Neurocognitive Capabilities, Physiological Responses to Cognitive Stress, and General Health and Fitness Measurements in Competitive Gamers versus Non-Gamers
by Nicole Hetrick, Anne Crecelius*Email: acrecelius1@udayton.edu
Received: 15 Jun 2022 / Published: 18 Mar 2024
Abstract
Competitive video gaming, also known as esports, is a growing industry worldwide. The physiological and cognitive impact of various training and play regimes has gained interest recently. The aim of this study was to characterize potential cognitive and physiological differences among competitive gamers and non-gamers while accounting for fitness levels. Specifically, the physiological parameters compared were differences in stress response (as measured by changes in heart rate and blood pressure) due to cognitive load (via various cognitive assessments) and fitness measurements such as body composition and health and skill related fitness components. Twenty-four total participants were studied [n=12 in gamers (10M, 2F, play >5 hrs/wk) and non-gamers (10M, 2F)]. The six different cognitive tests used were to measure various neurocognitive components that have previously been shown to be significantly different in gamers: the Stroop Test (cognitive set shifting, inhibitory control, and set twitching), Modified Card Sorting Test (problem solving and abstract thinking), Finger Tapping Test (psychomotor speed), Trail Making Test (speeded visual search and tracking), Spatial Processing Task (spatial recognition), and Iowa Gambling Test (risky decision making) were administered via a computer (Millisecond). After completing cognitive testing, each subject’s health-related fitness components (muscular strength and endurance, flexibility, and estimated aerobic capacity) were measured with a handgrip dynamometer, Situp Bleep test, V Sit and Reach Test, and Modified Bruce Treadmill, respectively. Skill-related fitness components (power, balance, hand-eye coordination) were measured with vertical jump, the Balance Error Scoring System, and the Alternate Hand Wall Ball Test, respectively. Body anthropometrics was measured through height, weight, BMI, body fat percentage (via bioelectrical impedance analysis). Of the cognitive components assessed, the only significant difference was that the video gamers had significantly higher average and dominant hands scores for the Finger Tapping Test and non-dominant scores that were trending towards significance versus the non-gamers. The systemic physiological responses to the cognitive testing were minimal and did not differ between the two groups. Given the potential impact of fitness on cognitive performance and sympathoexcitation, the fitness levels of the participants were not different. Thus, when physical activity is accounted for, competitive gamers and non-gamers perform similarly in most cognitive tasks and have similar physiological responses to this stress.
Highlights
- As designed, fitness measurements between the gamer and non-gamer groups were similar.
- Competitive gamers had significantly higher psychomotor speed in their right hand performance and averages of both hands during the Finger Tapping Test.
- No other significant differences were seen between non-gamers and competitive gamers for the cognitive tests studied nor was there a difference in the physiological responses during cognitive tests.
Introduction
Esports is an organized and competitive approach to playing computer games that has been growing globally (1). There are currently 45 national esports associations, and there are massive participation numbers during esports tournaments with 258 million global viewers in 2016 (1). There has been exponential growth in the number of players and viewers of esports, and there has been increasing consideration and movements that are allowing esports to be viewed with a similar respect as traditional sports. For example, there are 27 million daily players of League of Legends, and esports championships have reached up to 27 million viewers (2). As esports teams grow in college, scholarships are even being awarded that are comparable to traditional sports (2). Therefore, research into the world of esports gaming is necessary to better understand the cognitive and physiological health benefits or risks to those who compete.
Individuals who participate in these competitive video games train their dexterity of fine movements, rapidity of their eye-hand reflexes, cognitive skills, and strategy skills in order to obtain high level performance in esports. Competitive video gamers are thought to have higher levels of cognitive functioning due to the skills required to be successful in esport competitions (1). Competitive video gamers train anywhere from 3 to 17 hours in a day to improve reflexes, hand-eye coordination, fluid game control, spatial cognition, risk taking behavior, strategic abilities, and overall cognitive functioning to properly compete during tournaments and games (1). Competitive video gamers are believed to improve their cognitive functioning through advanced video game play. Neurocognitive testing can be done to indicate an individual’s level of cognitive function, and different tests can be used to look at various aspects of cognitive functioning such as motor speed, executive functioning, spatial configuration, visual tracking, inhibitory control, and more. Research has previously shown that gamers have improved visual speeded search (3), worsened inhibitory control and set shifting capabilities (3), improved risky decision-making (4), improved problem-solving skills (4), increased psychomotor speed (5), and improved spatial processing (6).
However, this prior research had not accounted for the impact of fitness on cognitive performance during these tests. Studies have shown that improved fitness correlates with improved cognitive performance (7). Therefore, this research wants to study the cognitive differences seen between competitive gamers and non-gamers when accounting for physical fitness. In addition, video gaming in general has previously been seen as a more leisurely activity. However, research has shown that there are significant increases in heart rate during competitive video gaming sessions, and the levels of sympathetic activity were shown to be consistent with vigorous aerobic exercise rather than sedentary activity (2). Therefore, esports athletes experience sympathetic nervous system (e.g., ‘stress’) responses during play. Overactive stress responses can impair cognitive ability. However, comparisons of stress responses to cognitive testing have not been done between gamers and non-gamers in prior research, so this research assessed any differences between stress responses between these two groups while completing the cognitive tests. Heart rate (HR) and blood pressure (BP) are physiological parameters that vary with physiological and cognitive exertion, and these can be utilized to estimate sympathetic nervous system activity (8). Therefore, our research will look at variations in both heart rate and blood pressure to assess differences in the stress responses between these two groups incited by the cognitive tests.
The purpose of this research is to characterize the neurocognitive capabilities and physiological responses to cognitive stress when accounting for health fitness measures in competitive gamers and non-gamers. When accounting for fitness between gamers and non-gamers, we believe the competitive video gamer participants will show higher levels of cognitive functioning and a more adaptive physiological response to cognitive testing.
Methodology
Sample
Participants were recruited through convenience sampling upon approval from the Institutional Review Board at the University of Dayton. The study also complies with the Declaration of Helsinki. Further, gamer and non-gamer participants aged 18 to 28 were recruited from the Dayton, Ohio area including the surrounding cities. For the purposes of this study, competitive gamers were defined as individuals who played video games for at least 5 hours a week. In this study, 26 participants were recruited and participated in this study. However, only 24 (12 gamers and 12 non-gamers) participants were included in analysis due to technical errors with two participants (error in physiological data recording in one and incomplete data files for cognitive tests in other). There were ten males and two females in each group, and subject demographics are shown in Table 1 (see results). The exclusion criteria for this study ensured participants were non-smokers, non-obese (BMI < 30 kg/m2), normotensive <140/90 mmHg), and not taking any medications that might have a significant impact on physiological responses such as heart rate and blood pressure. Participants in the gamer and non-gamer groups were matched based on physical fitness to remove fitness as a potential confounding variable to the cognitive results.
Participants were asked to fast for four hours and refrain from caffeine, alcohol and exercise for at least 12 hours prior to participating in this study. Informed consent was obtained from all individuals prior to participation. After giving informed consent, participants began by completing a health questionnaire to rule out any health concerns that may impede their ability to complete any of the cognitive or fitness tasks required for this study. Then participants completed the International Physical Activity Questionnaire, so researchers could get an understanding on the background of participants’ fitness activities (9).
Measures and Variables
Body Anthropometrics. Participants first had their height, weight, and BMI measured on a standard medical scale to assess body composition. Then, body fat percentage (%) was obtained through bioelectrical impedance (430-U, Tanita, Arlington Heights, IL, USA). These values were used to consider body composition for the health and fitness data.
HR and MAP. Participants were then sat at the computer where physiological and cognitive testing would begin. Participants had beat-to-beat blood pressure waveforms obtained (Finometer NOVA, Finapres Medical Systems BV, Amsterdam, The Netherlands), and heart rate measurements were taken through a 3-lead ECG. These measurements were taken throughout the duration of the cognitive tests.
Cognitive Tests. Participants completed all of the following cognitive tests, sequentially, on a computer through Millisecond software.
- Finger Tapping Test (FTT). The FTT assesses psychomotor speed (8). Participants had to tap a spacebar as fast as they could in 10 seconds, and cognitive function was assessed by the number of taps made for both the dominant hand, non-dominant had, and the average of both hands combined.
- Iowa Gambling Test (IGT). The IGT assesses risky decision-making (4). In this test, participants have to choose from 4 decks of cards for 100 trials, and their goal is to have as much money as possible at the end of this test. There are two decks that are considered advantageous, and there are two decks that are considered disadvantageous. The advantageous decks allow participants to build up wealth slowly with very low risk of loss, but the disadvantageous decks allow for participants to build wealth up quickly with a much higher risk of loss. Risky decision-making was then assessed by looking at the participants' net value of advantageous minus disadvantageous choices. The 100 trials were split up into five assessed blocks. The first two blocks are considered the time where participants are familiarizing themselves with the advantageous and disadvantageous decks, and the last three blocks are the assessment of risky-decision making (4).
- Modified Card Sorting Task (MCST). The MCST assesses abstract thinking and problem solving (4). Participants are presented with a card that can have various categories relating to shapes, colors of shapes, and number of shapes presented. Participants must choose from four response cards whichever card matches the pattern being tested in comparison to the given card. There is only one feature that the response cards share with the given card. Only one feature is the category or pattern that the test is assessing, and participants are asked to determine the pattern that the test is using through trial and error. This pattern changes throughout the test. Abstract thinking and problem solving were assessed based on the number of errors made by participants.
- Trail Making Test (TMT). The TMT assesses visual speeded search (8). There was a trail A and trail B in this study. In trail A, participants were asked to connect the dots by number in numerical order by dragging their mouse to create continuous connecting lines as fast as possible. In trail B, participants were asked to do the same but with the added mental flexibility of letters. Participants must connect the dots from number to the corresponding letter in chronological order. For example, they must connect 1 to A, A to 2, and then 2 to B. Visual speeded search is assessed by total completion time.
- Spatial Processing Task (SPT). The SPT test assesses at spatial recognition (10). During this test, participants are presented with an upright six bar histogram that they are allowed to look at for three seconds. Then, participants are presented with an upside- down 6 bar histogram, and participants have to determine if it was the same or different histogram than what was originally provided. The percentage of correct answers and response time of participants answers were used to measure visuospatial skills through speed and accuracy in these groups.
- The Stroop Test (Stroop). The Stroop assesses cognitive set shifting and set inhibition (8). Participants are presented with a word. The word itself is a color, and the word is also printed in a specific color. The participants answer has to be the color that the word is presented in. There are congruent, incongruent, and control trials in this test. The control trials are colored blocks. The congruent trials occur when the color of the word and the word itself are the same. The incongruent trials occur when the color of the word and the word itself are different. The speed and accuracy were assessed to measure participants’ cognitive set shifting and set inhibition abilities by looking at the proportion correct and reaction time.
Fitness Assessments. After completing the cognitive tests, participants were given up to 20 minutes of rest and they were offered an Ensure health bar. Then, participants began the physical fitness tests. Health-related fitness components were measured through the handgrip dynamometer, Sit-up Bleep Test, V-sit and Reach test, and the Modified Bruce Treadmill, and skill-related fitness components were measured through vertical jump height, Balance Error Scoring System, and the Alternate Hand Wall Ball test. Body anthropometrics were measured through height, weight, BMI, and body fat percentage.
- Handgrip Dynamometer. The participants used the handgrip dynamometer to measure muscular strength (11). The subject was sat in a chair, and they were asked to squeeze the dynamometer three times with their left hand followed by their right hand. There was a 1-minute interval between each squeeze. A total of six data collections were made for each participant.
- V-Sit and Reach. Then, participants performed the V-Sit and Reach to measure flexibility (12). This test involves sitting on the floor with legs stretched out straight ahead. The soles of an individual’s feet are placed flat against the testing box. Both knees should be locked and pressed flat to the floor with their palms facing downwards, and their hands should be on top of each other or side by side. The subject reaches forward along the measuring line as far as possible. After some practice, the participant reaches out and holds that position for at least one to two seconds while the distance the person stretched is recorded. The average of the best two collections is taken.
- Balance Error Scoring System (BESS). Then, the Balance Error Scoring System (BESS) test assesses balance (13). This test involves using both the solid ground and foam pad for participants to assess balance for twenty second tests without shoes. There were three different balance assessments done which are the single leg stance, double leg stance, and tandem stance. The double leg stance involves standing on a firm surface with feet touching by each other's side, hands on their hips, and eyes closed. The single leg stance is like the double leg stance but requires the subject to stand with their non- dominant foot and the hip is flexed to roughly 30°, and the knee is flexed to around 45°. The tandem stance requires eyes to be closed with the participant’s hands on their hips, and they must be standing heel to toe on a firm surface with their non‐dominant foot in the back. The heel of the dominant foot will be touching the toe of the non‐ dominant foot. A point is added each time the participant makes an error. The errors are moving the hands off of the iliac crests, opening the eyes, step, stumble, fall, abduction or flexion of the hip beyond 30°, lifting the forefoot or heel off of the testing surface, remaining out of the proper testing position for greater than 5 seconds.
- Sit-up Bleep Test. Then participants perform the sit-up bleep test to measure muscular endurance (14). The subject lies with knees flexed and their feet are approximately 12 inches from their buttocks. A researcher assists by anchoring their feet to the ground. Their arms are held flat across the chest with their hands placed on opposite shoulders. The subject raises the trunk, keeping the arms in position, curling up to touch their elbows to thighs. Then, they lower back to the floor so that the shoulder blades (upper back) touch the floor. Then, the maximum number of sit-ups performed in one minute is recorded.
- Vertical Jump Test. Next, the participants performed the vertical jump test to measure lower body power (15). The subject stands side next to a pole with rungs for measurement of vertical height. They reach up with their hand and keeping their feet flat on the ground, and the height of their fingertips is marked or recorded. They then leap vertically as high as possible using both arms and legs to assist in projecting the body upwards. They attempt to touch the rung at the highest point of the jump. The difference in distance between the standing reach height and the jump height is the score. The best of three attempts is recorded.
- Alternate Hand Wall Ball Test. The alternate hand wall ball test is used to assess hand- eye coordination (16). A mark is placed 3 ft from the wall. The person stands behind the line and faces the wall. The ball is thrown from one hand in an underarm action against the wall, and it is attempted to be caught with the opposite hand. The ball is then thrown back against the wall and caught with the initial hand. The test has three attempts that each occur for 30 seconds. The best of 3 attempts is taken.
- Modified Bruce Treadmill. Lastly, the Modified Bruce Treadmill assesses submaximal VO2 predictions (17). This test involves participants walking on a treadmill, and the speed and incline increases every three minutes. The test will stop for participants when a participant has reached 85% of their maximum heart rate, their heart rate goes above 115 beats per minute for two stages, or the researcher or participant decides that the test should no longer continue. If the participant’s heart rate changes more than six beats per minute between the second and third minute of any stage of the test, they remain at the same level of speed and incline for an added 60 seconds in order for the participant to achieve a steady state in heart rate. The participants' heart rate and blood pressure will be measured throughout this test using a chest strap HR monitor and manual sphygmomanometer for blood pressure. The length of time on the treadmill is the test score and can be used to estimate the VO2 max value. During the test, heart rate, blood pressure and ratings of perceived exertion are also collected. The treadmill is set to a tolerable level for the subject, and the test can be stopped at any point if the subject requests to stop or experiences any significant symptoms.
Data Acquisition. Data collected from the physiological stress portion of the experiment was stored on a computer and was averaged using LabChart 8 (PowerLab, ADInstruments). Mean arterial pressure (MAP) was determined from the beat-to-beat blood pressure measurements taken during the cognitive tests. These measurements were compared to the MAP calculated from the average of two blood measurements determined through a blood pressure sphygmomanometer taken prior to the start of the cognitive tests. The differences between the blood pressure measurements taken through finger plethysmography and blood pressure cuff were accounted for throughout the MAP measurements. The data represented an average of the studied time period for each test.
Data Analysis. Data are presented as a mean ± standard deviation (S.D.) scores for gamers and non-gamers in the cognitive, physiological, and fitness trials. Differences between these two groups were determined with a 2-tailed Student’s T-Test. Test significance was set at p<0.05. The change (Δ) data for MAP and HR was calculated from the difference between these measurements taken prior to the cognitive test and during the specified cognitive test.
Results
Subject Demographics and Body Anthropometrics
All subjects completed the protocol. Table 1 shows subject demographics with the number of males and females in the study, and it shows the mean ± S.D. values in age, height, weight, and body fat percentage during the body anthropometric portion of this study which showed no significant differences.
Table 1. Demographics of gamers and non-gamers presented as mean ± S.D.| Demographics | |||
|---|---|---|---|
| Gamers | Non-Gamers | Sig. (P) | |
| Sex (Male:Female) | 10:2 | 10:2 | |
| Age (years) | 22.1 ± 2.4 | 22 ± 1.7 | 0.922 |
| Height (cm) | 175.5 ± 9.8 | 178.1 ± 8.8 | 0.507 |
| Weight (kg) | 75.6 ± 14.9 | 80.4 ± 11.7 | 0.378 |
| Body Fat (%) | 17.5 ± 6.5 | 16.2 ± 8.3 | 0.665 |
Skill and Health-Related Fitness Components
Table 2 shows the skill and health-related fitness measurements taken for gamers and non- gamers with the mean ± S.D. values taken, and the following measurements were compared between these two groups for VO2 max (p = .796), sit-ups (p =0.609), average handgrip strength (p = 0.907), V-sit and reach (p = 0.417), BESS score (p = 0.763), vertical jump height (p = 0.751), and ball toss catches (p = 0.591). Table 2. Fitness Measurements in gamers and non-gamers presented as mean ± S.D.| Fitness | |||
|---|---|---|---|
| Gamers | Non-Gamers | ||
| Health-Related | VO2 Max | 46.4 ± 4.8 | 46.9 ± 5.9 |
| Situps | 32.7 ± 7.2 | 34.5 ± 9.9 | |
| Avg Handgrip (mmHg) | 128.6 ± 34.4 | 126.1 ± 65.7 | |
| V-Sit (cm) | 25.4 ± 9.8 | 22.5 ± 9.0 | |
| Skill-Related | BESS (Total Errors) | 10.8 ± 7.1 | 9.9 ± 6.2 |
| Vert Jump (inches) | 18.1 ± 3.9 | 18.625 ± 3.8 | |
| Ball Toss (# of catches) | 27.5 ± 7.7 | 26.1 ± 4.7 | |
Physiological Stress Data
Table 3 shows the estimated sympathetic nervous system activity during all of the cognitive tests for ΔHR and ΔMAP data. The ΔMAP was measured and compared between both groups for the FTT (p = 0.661), IGT (p = 0.262), TMT (p = 0.124), MCST (p =0.344), SPT (p = 0.615), and Stroop (p = 0.473). The Δ in HR were measured and compared between both groups for the FTT (p = 0.615), IGT (p = 0.121), TMT (p = 0.629), MCST (p = 0.549), SPT (p = 0.308), Stroop (p = 0.444).
Table 3. Heart rate (HR) and mean arterial pressure (MAP) data from the cognitive testing presented as mean ± S.D.| Measurement | Test | Gamers | Non-Gamers |
|---|---|---|---|
| ∆MAP (mmHg) | FTT | 1.4 ± 3.1 | 0.7 ± 3.9 |
| IGT | 1.3 ± 2.2 | 0.5 ± 1.2 | |
| TMT | 1.5 ± 2.4 | 0.2 ± 1.5 | |
| MCST | 0.5 ± 1.3 | -0.01 ± 1.4 | |
| SPT | -0.2 ± 3.2 | -0.9 ± 4.1 | |
| Stroop | 0.01 ± 6.0 | -1.3 ± 2.5 | |
| ∆HR (BPM) | FTT | 4.5 ± 7.7 | 6.0 ± 6.7 |
| IGT | -3.1 ± 4.0 | 0.03 ± 4.8 | |
| TMT | -1.7 ± 4.7 | -2.9 ± 5.4 | |
| MCST | -3.3 ± 5.1 | -2.2 ± 4.7 | |
| SPT | -1.7 ± 6.6 | -4.2 ± 5.0 | |
| Stroop | -1.8 ± 4.4 | 0.23 ± 7.7 |
Cognitive Tests
Figure 1 - Number of taps completed on average for gamers and non-gamers for the FTT results with trials for their dominant and non-dominant hand and the average between both of their hands. Individual dots represent individual data points with gamers and non-gamers represented by their respective symbols, (solid black circles vs grey open triangles). Black horizontal lines represent mean ± standard deviations. *p < 0.05, gamers vs non gamers.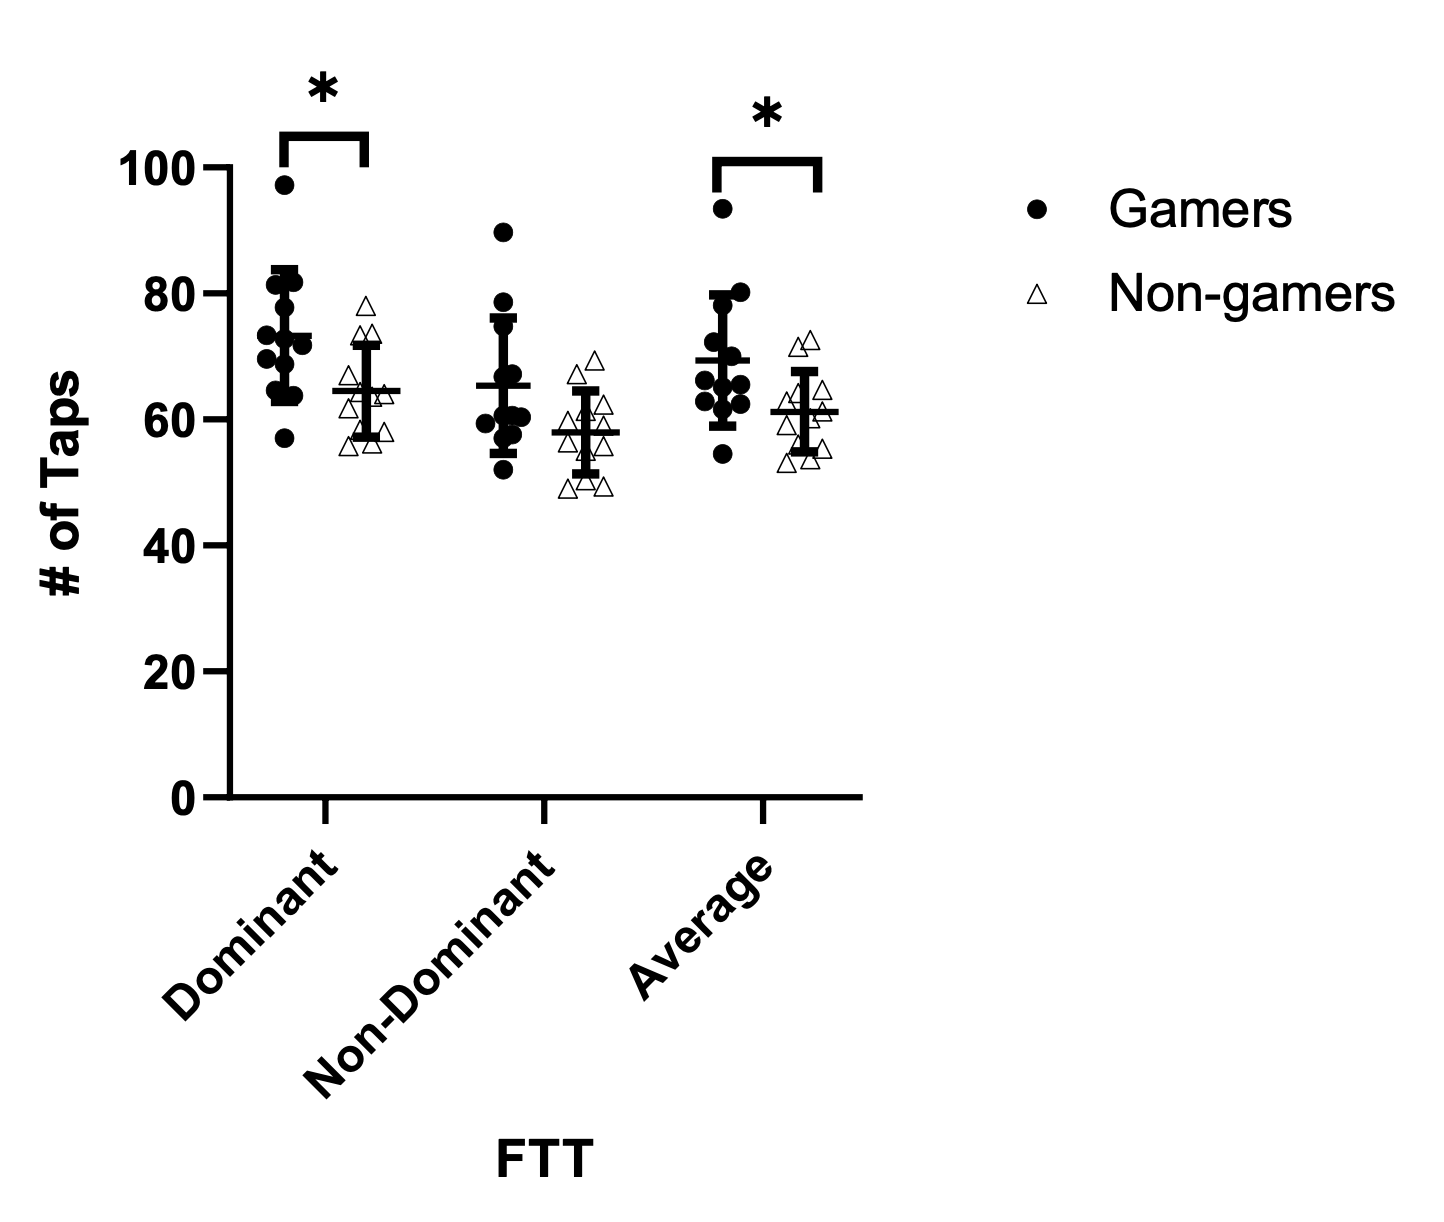
Figure 2 - Shows the net value of choices, or advantageous minus disadvantageous choices, made by participants for the IGT. Data points above the 0 line represent overall more advantageous decisions while data points below the zero line represent more disadvantageous decisions. Individual dots represent individual data points with gamers and non-gamers represented by their respective circles, (solid black circles vs grey open triangles). Black horizontal lines represent mean ± standard deviations. *p < 0.05, gamers vs non gamers.
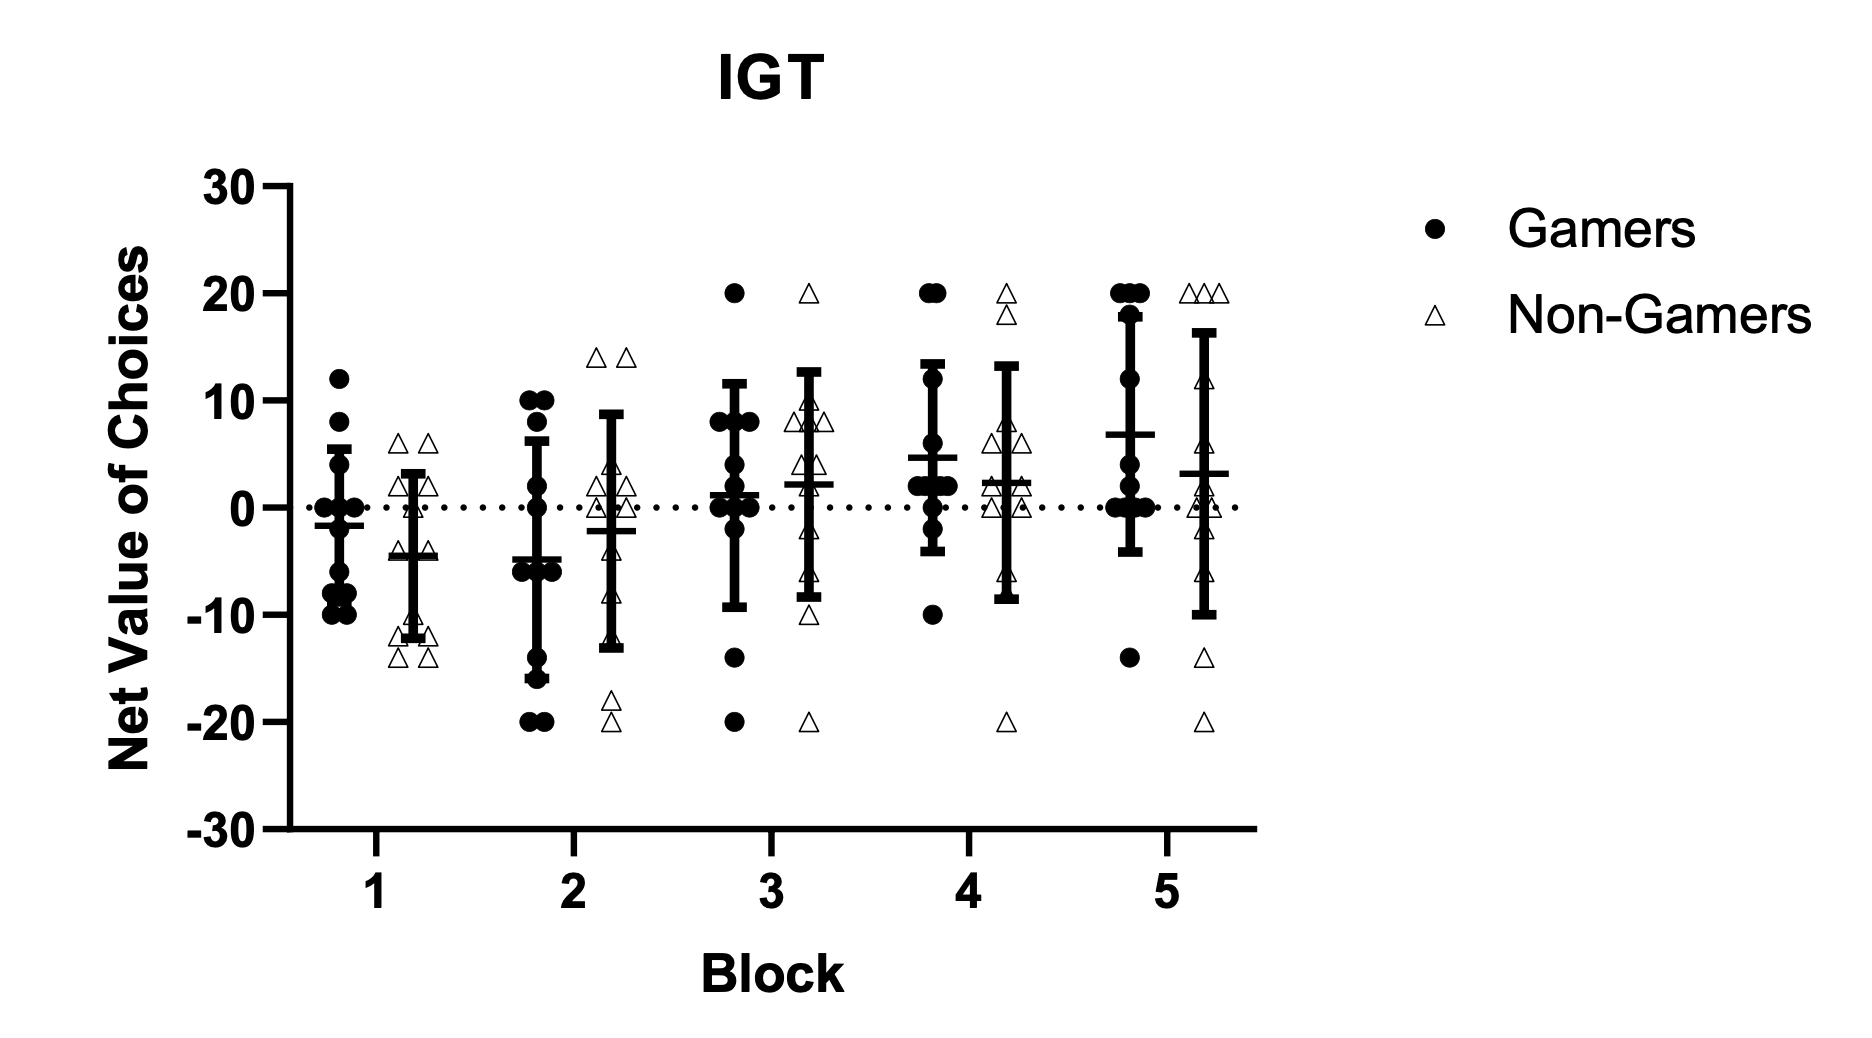
Figure 3 - Shows the completion time in milliseconds (ms) for the TMT trials for participants for trial 1 represented on the left and the completion time for trial 2 on the right. Individual dots represent individual data points with gamers and non-gamers represented by their respective circles, (solid black circles vs grey open triangles). Black horizontal lines represent mean ± standard deviations. *p < 0.05, gamers vs non gamers.
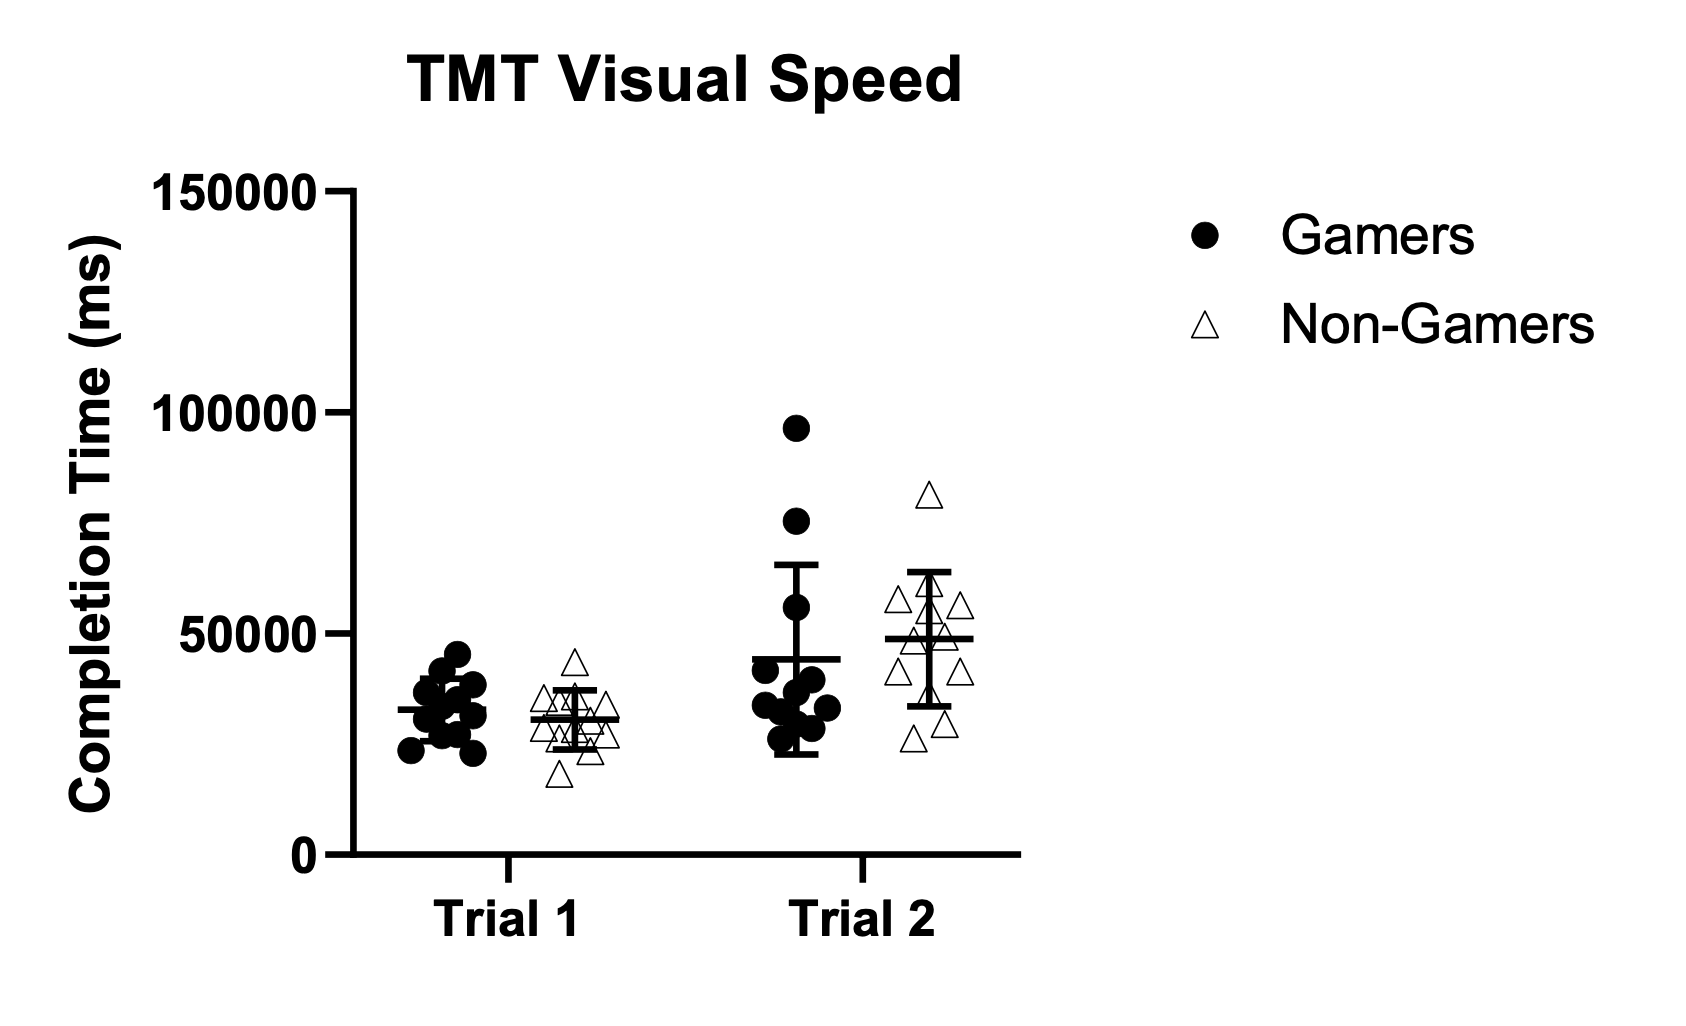
Figure 4 - Shows the total number of errors made by participants while completing the MCST for gamers and non-gamers. Individual dots represent individual data points with gamers and non- gamers represented by their respective circles, (solid black circles vs grey open triangles). Black horizontal lines represent mean ± standard deviations. *p < 0.05, gamers vs non gamers
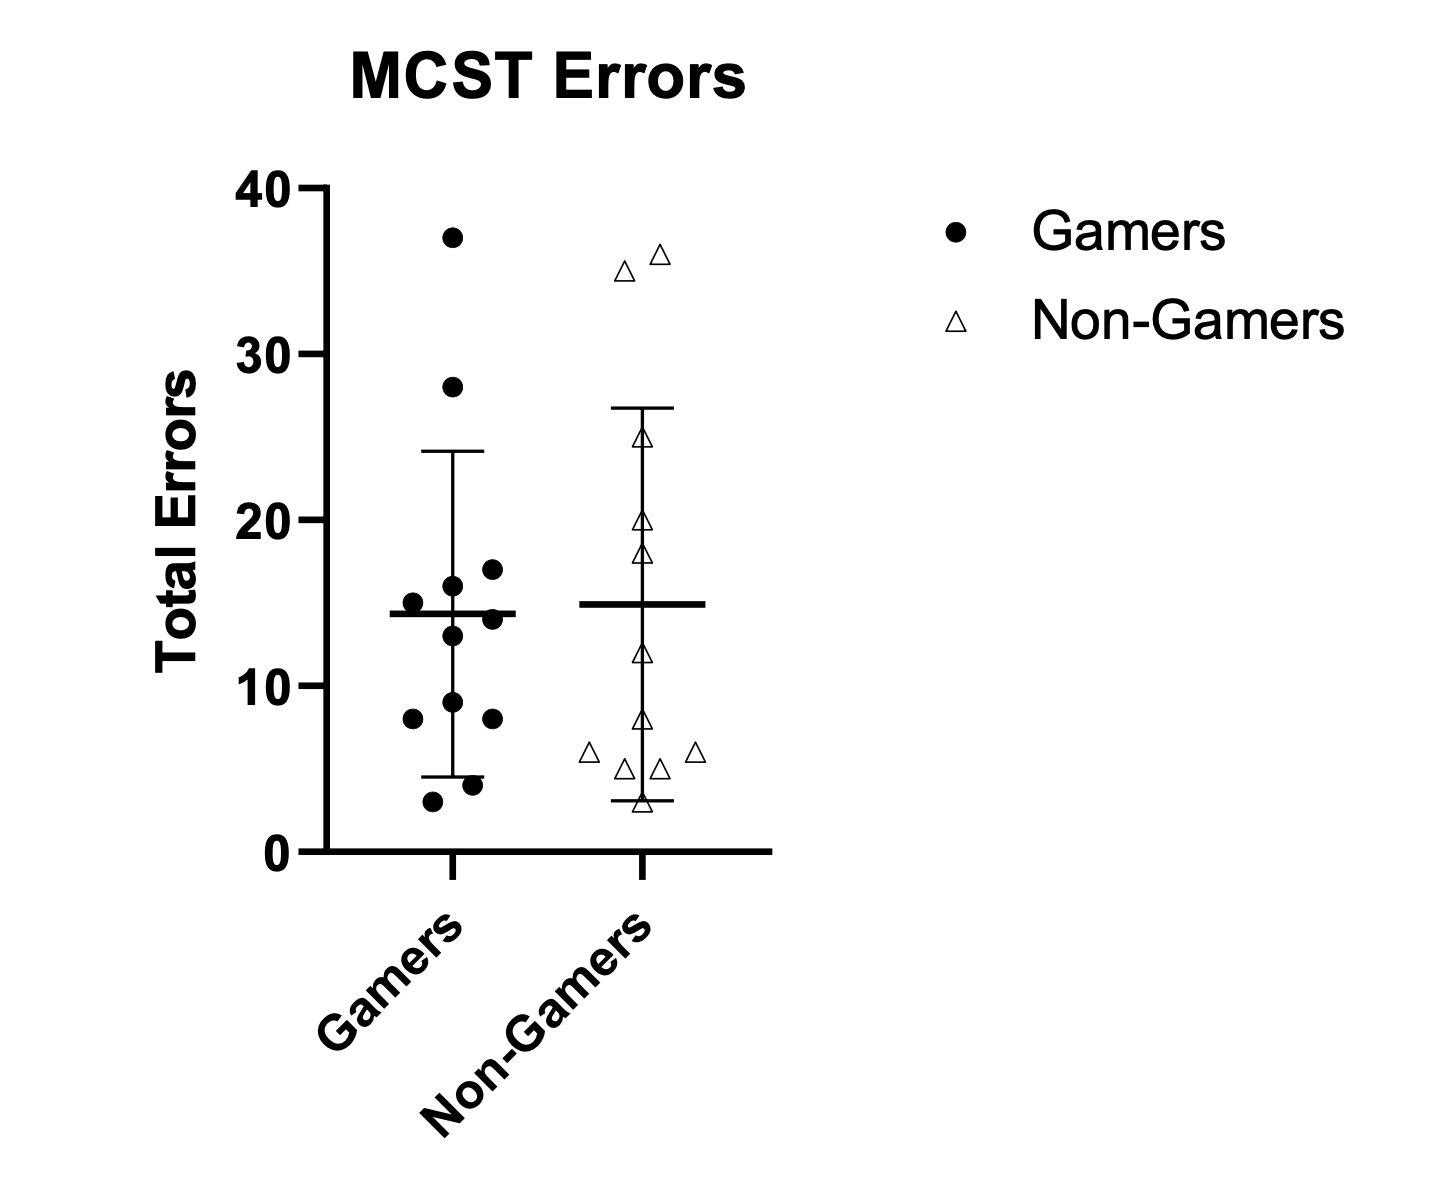
Figure 5 - Shows the proportion of correct answers for the Stroop Test and SPT on parts A and B respectively, and the figure also shows the reaction time of participants during the Stroop Test and SPT on parts C and D respectively. Individual dots represent individual data points with gamers and non-gamers represented by their respective circles, (solid black circles vs grey open triangles). Black horizontal lines represent mean ± standard deviations. *p < 0.05, gamers vs non gamers.
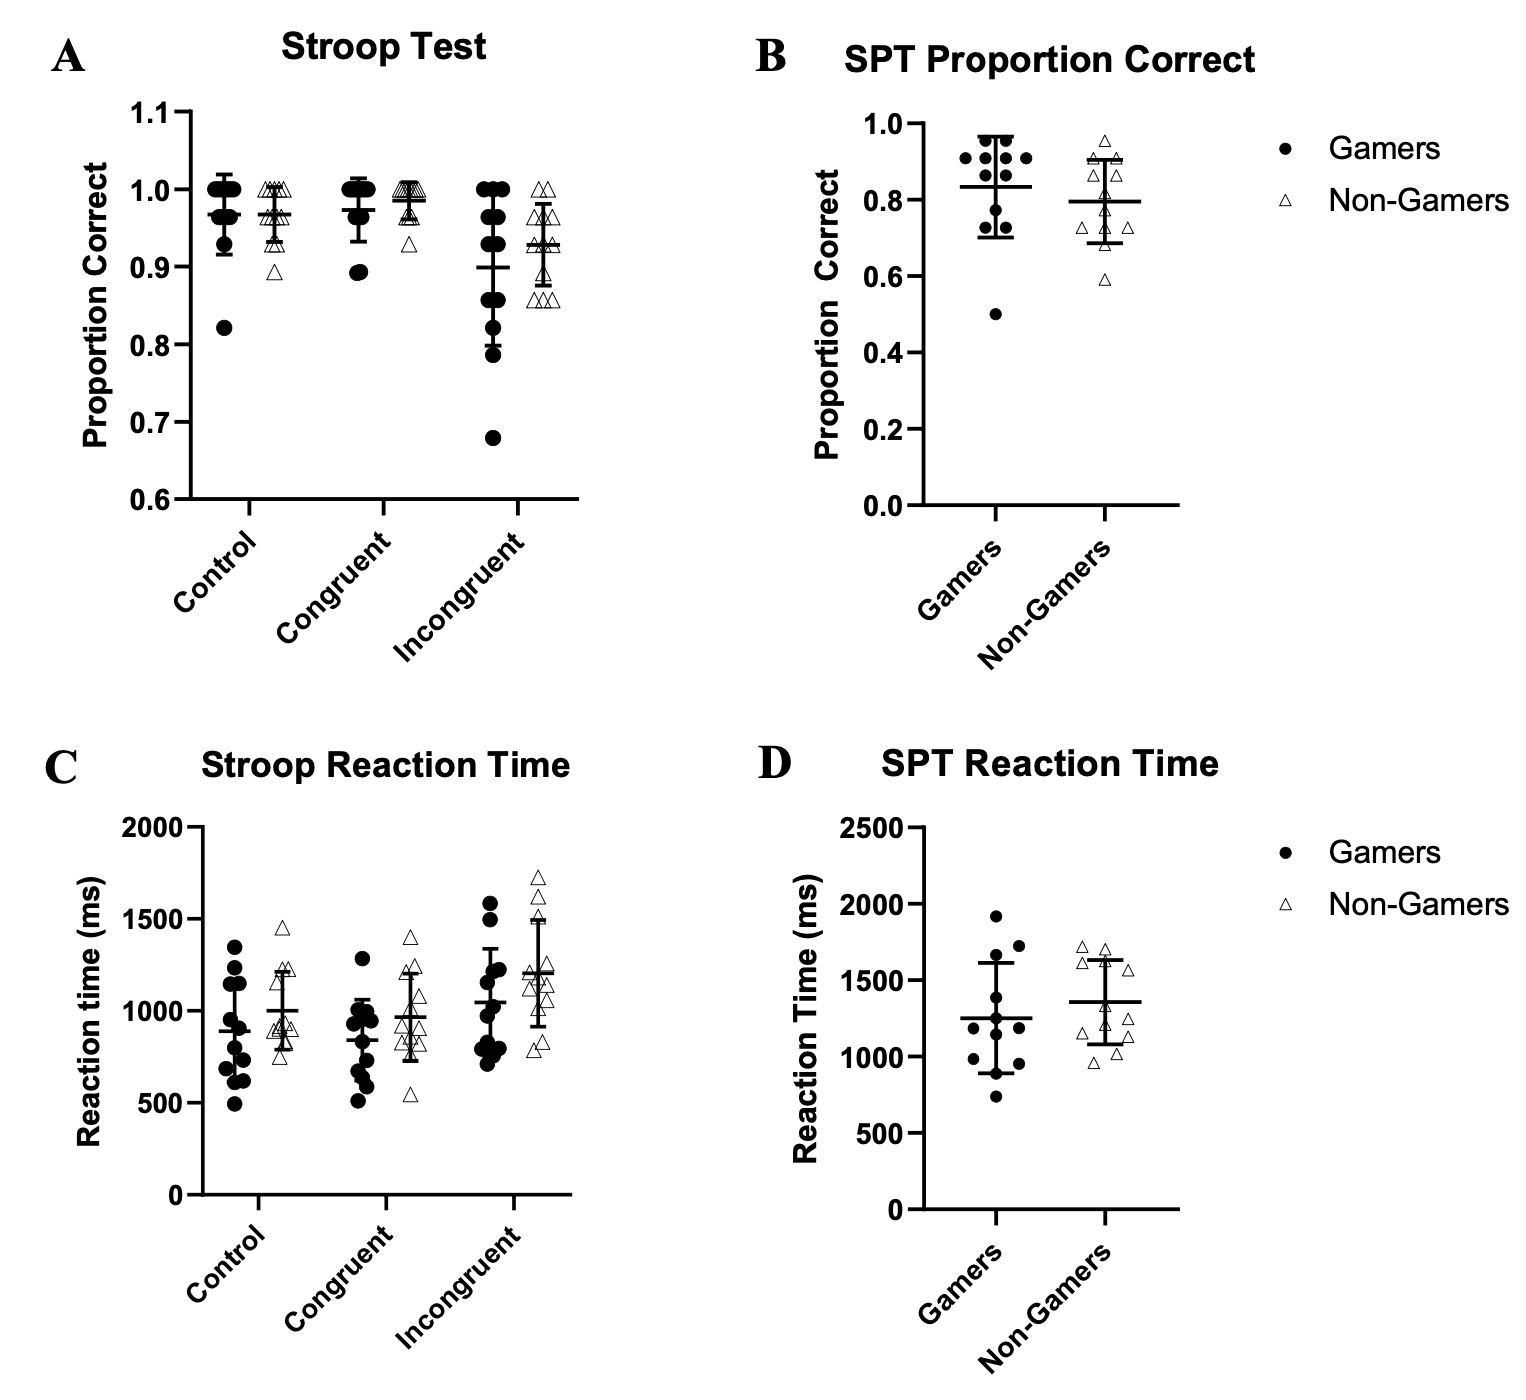
Figures 2 shows the significant results during the FTT comparing the number of taps between gamers’ dominant (73.332 ± 10.433) and average of both hands (70.067 ± 10.427) to non-gamers dominant (64.516 ± 7.280; p = .025) and average between both hands (61.224 ± 6.383; p = .031). It also shows the non-significant (albeit barely) results of the non-dominant hand for gamers (65.391 ± 10.771) and non-gamers (57.933 ± 6.598; p = 0.053). Figure 3 demonstrates the non-significant results in the net choices for the IGT in block 1 through block 5 consecutively between gamers (-1.667 ± 7.127, -4.833 ± 11.069, 1.167 ± 10.426, 4.667 ± 8.752, 6.833 ± 10.970) and non-gamers (-4.500 ± 7.681, -2.167 ± 10.903, 2.167 ± 10.495, 2.333 ± 10.882, 3.167 ± 13.141; p = .359, 0.558, .817, 0.569, 0.466). Figure 4 demonstrates the non-significant results for the completion time in the TMT between gamers in trail 1 (32781.583 ± 7033.611) and trail 2 (44126.667 ± 21491.334) and non-gamers in both trail 1 (30522.167 ± 6666.901; p = 0.428) and trail 2 (48762.333 ± 15324.675; p = 0.548). Figure 5 demonstrates the non-significant results for number of errors on the MCST between gamers (14.333 ± 9.801) and non-gamers (14.917 ± 11.828); p = 0.897). Figure 6 demonstrates the non-significant results for comparing SPT for gamers in accuracy (0.833 ± 0.132) on part A and speed (1251.935 ± 360.923) in part B to non- gamers accuracy (0.795±0.109; p = 0.451) and speed (1356.340 ± 275.407; p = 0.434). Figure 7 demonstrates the non-significant results for comparing Stroop performance in congruent, incongruent, and control trials respectively for gamers in accuracy (0.973 ± 0.041, 0.899 ± 0.101, 0.967 ± 0.052) on part A and speed (763.257 ± 324.597, 1045.960 ± 292.245, 889.731 ± 277.351) in part B to non-gamers accuracy (0.985 ± 0.024, 0.928 ± 0.053, 0.967 ± 0.035; p = 0.390, 0.379, 0.998) and speed (965.831 ± 237.297, 1204.530 ± 290.237, 1000.978; p = 0.095, 0.196, 0.282).
Discussion
The fitness results showed no significant differences between the gamer and non-gamer groups which suggests that this research adequately matched participants in these groups based on fitness. Therefore, fitness cannot contribute as a confounding variable in the cognitive results. In addition, there were no significant differences seen between the stress responses for the two groups, and this suggests that there were no differences in the physiological adaptability to cognitive stress between these two groups as well. For the cognitive tests, this study’s results indicate that competitive gamers show improved psychomotor speed in comparison to non-gamers when fitness is accounted for based upon the FTT test scores. However, no other significant differences were seen between the gamers and non-gamers for any of the other cognitive tests.
Despite prior research showing significant increases in heart rate activity during gaming (2), this does not appear to incite differences in adaptability to the stress of the cognitive load of these tests in gamers. Additionally, the sympathoexcitation response and fitness results indicate that stress and fitness variations were not confounding variables contributing to cognitive results in our results. Therefore, when accounting for fitness, the only cognitive skill that was significantly improved in gamers was psychomotor speed, but there were no significant differences seen in any of the other cognitive data.
These are novel results in comparison to prior research showing worsened inhibitory control and set shifting capabilities (3) and improved visual speeded search (3), risky decision-making (4), problem-solving skills (4), psychomotor speed (5), and spatial processing (6) in gamers. A possible explanation for these novel results is that matching participants based in fitness levels reduced potential cognitive differences that occurred due to fitness variations. Prior research has shown that increasing fitness can improve cognition (7), and improved fitness levels could have contributed to differences in cognitive scores among participants in prior studies. However, this research better assures that fitness is not an underlying variable that could have contributed to differences or similarities seen in the cognitive results. Additionally, psychomotor speed is a vital skill for gamers because dexterity of fine movements and rapidity of their eye-hand reflexes are crucial to a gamer’s success. Players are often rewarded in competitive gaming situations by reacting faster than opponents, and they train to improve this skill directly in order to win competitions. Therefore, psychomotor speed is a cognitive skill that is important for gamers, so it makes sense that this skill would be significantly higher due to their training and gaming.
Our results, in the context of prior literature highlights the need to cautiously interpret published results of cognitive differences in gamers vs non-gamers. Our goal was to account for any potential differences in fitness, which likely contributed to some of the observed differences versus prior work. In addition, in any small cross-sectional study, the characteristics of the subjects must also be carefully considered. Additional work is needed to prospectively and/or longitudinally examine gaming behavior and the potential direct impact on aspects of cognitive skills.
Considerations
One consideration for this study is that gamers and non-gamers might not have shown significant differences in their adaptability to cognitive stress due to the potentially non- stressful nature of the cognitive tests. Therefore, the cognitive tests might not have incited a significant stress response in both of these groups, so this could explain the limited stress responses in these participants. In addition, another consideration is that the gamers who participated in this study were only required to have played for at least five hours a week. However, some competitive gamers play up to 17 hours in a single day. Therefore, further cognitive differences could be seen between gamers and non-gamers if even higher skilled gamers had been recruited.
Additional experimental limitations also exist for this study including the relatively low sample size, and fairly generalized classification of gamers. We did not obtain specifics regarding the exact number of hours played, specific games played, level of competitiveness, or historical experience with gaming. We based our inclusion criteria on previous studies and acknowledge the limitations of generalizing these results to all populations of gamers.
Future Research
Future research needs to be done in esports players to understand more of the cognitive and physiological impacts of competitive gaming. We hope this research guides further studies that can look at other potential cognitive differences between gamers and non-gamers unstudied in this research. Future research also needs to be done on the physiological impacts of gaming. Potentially, future research can look more into how gamers respond to competitive gaming during a tournament with a variety of stress response measurements, and studies could also consider looking more into the strategies of competitive gamers when making decisions and solving obstacles in comparison to the way non-gamers strategize problem- solving.
Conclusion
The data derived from this research suggests that competitive esports players have higher psychomotor speed than non-gamers, but all other tested cognitive abilities and sympathetic nervous system responses to the mental tasks are not significantly different when fitness is accounted for.
Acknowledgments
We would like to thank all of the subjects who agreed to participate in this study.
Declaration of interest statement
The authors report no conflict of interest. This research was supported by the University of Dayton Honors Program (NH), University of Dayton College of Arts & Sciences Dean’s Summer Fellowship (NH) and School of Education and Health Sciences Summer Research Fellowship (ARC).
References
- Fiore, R., Zampaglione, D., Murazzi, E., Bucchieri, F., Cappello, F., Fucarino, A. The esports conundrum: is the sports sciences community ready to face them? A perspective. The Journal of Sports Medicine and Physical Fitness. 2020; 60(12):1591-1602. doi: 10.23736/S0022-4707.20.10892-2.
- Andre, T., Walsh, S., Valladao, S. and Cox, D. Physiological and perceptual response to a live collegiate esports tournament. International Journal of Exercise Science. 2020;13(6):1418 -29.
- Kowal, M., Toth, A.J., Exton, C., & Campbell, M.J. Different cognitive abilities displayed by action video gamers and non-gamers. Computers in Human Behavior. 2018; 88; 255- 262.
- Buelow, MT., Okdie, BM., and Cooper, AB. The influence of video games on executive functions in college students. Computers in Human Behavior. 2015; 45:228–234.
- Kazimoglu C and L. Bacon. An analysis of a video game on cognitive abilities: A study to enhance psychomotor skills via game-play, IEEE Access. 2020; 8;110495-110510
- Gagnon, D. Videogames and spatial skills: An exploratory study. Educational Technology Research and Development. 1985; 33:263–275.
- Mandolesi, L., Polverino, A., Montuori, S., Foti, F., Ferraioli, G., Sorrentino, P., & Sorrentino, G. Effects of physical exercise on cognitive functioning and wellbeing: Biological and psychological benefits. Frontiers in Psychology. 2018; 9; 509.
- Sousa A, Ahmad SL, Hassan T, Yuen K, Douris P, Zwibel H and DiFrancisco-Donoghue J. Physiological and cognitive functions following a discrete session of competitive esports gaming. Frontiers in Psychology. 2020; 11:1030. doi: 10.3389/fpsyg.2020.01030
- Ainsworth, B. E., Bassett, Jr., Strath, S., et al. Comparison of three methods for measuring the time spent in physical activity. Medicine & Science in Sports & Exercise. 2000; 32(9):S457-64
- Englund, C.E., Reeves. D.L., Shingledecker, C.A., Thorne, D.R., Wilson, K.P., & Hegge. F.W. Unified Tri-Service Cognitive Performance Assessment Battery (UTC-PAB) I. Design and Specification of the Battery. 1987. Report No. 87-10, Naval Health Research Center, P 0 BOX 85122, San Diego, CA 92138 Naval Medical Research and Development Command, Bethesday, MD
- Trosclair, D., Bellar, D., Judge, LW., Smith, J., Mazerat, N., Brignac, A. Hand-Grip Strength as a Predictor of Muscular Strength and Endurance. Journal of Strength and Conditioning Research. 2011; 25:S99. doi: 10.1097/01.JSC.0000395736.42557.bc
- Cuberek, R., Machová, I., Lipenská, M. Reliability of V sit-and-reach test used for flexibility self-assessment in females. Acta Gymnica. 2013; 43(1):35-39
- Bell, D. R., Guskiewicz, K. M., Clark, M. A., & Padua, D. A. Systematic review of the balance error scoring system. Sports Health. 2011; 3(3): 287–295. https://doi.org/10.1177/1941738111403122
- Bianco, A., Lupo, C., Alesi, M., Spina, S., Raccuglia, M., Thomas, E., Paoli, A., & Palma, A. The sit up test to exhaustion as a test for muscular endurance evaluation. SpringerPlus, 2015; 4:309. https://doi.org/10.1186/s40064-015-1023-6
- Brooks, ER., Benson, AC., Bruce, LM. Novel technologies found to be valid and reliable for the measurement of vertical jump height with jump-and-reach testing. Journal of Strength and Conditioning Research. 2018; 32(10):2838-2845. doi: 10.1519/JSC.0000000000002790.
- Faber, IR., Oosterveld, FGJ., Nijhuis-Van der Sanden, MWG. Does an eye-hand coordination test have added value as part of talent identification in table tennis? A Validity and Reproducibility Study. PLoS ONE. 2014; 9(1): e85657. https://doi.org/10.1371/journal.pone.0085657
- Pescatello, L. S. ACSM's Guidelines For Exercise Testing and Prescription. 9th ed. Philadelphia, USA: Kluwer/Lippincott Williams & Wilkins Health; 2014.