The one billion dollar myth: Methods for sizing the massively undervalued esports revenue landscape
by Joseph Ahn, William Collis, Seth Jenny*Email: dr.sethjenny@gmail.com
Received: 20 Jul 2020 / Published: 04 Oct 2020
Abstract
It is our contention that the 2019 esports industry’s revenue size is massively undervalued at $1.1B USD within the literature. This paper provides a more accurate sizing of the esports landscape, incorporating into the analysis six major sectors of the esports industry: 1) teams, professional players, and streamers, 2) game publishers, 3) streaming platforms, 4) physical products, 5) leagues and tournaments, and 6) digital tools. Each sector is discussed separately, with descriptions of the business models and corresponding revenue equations that drive each sector’s revenue estimates. Overall, we purport that $24.9B USD is a more accurate estimation of the “true” market size of esports for 2019.
Highlights
- The esports market size is massively undervalued at $1.1B USD annual revenues.
- We propose mathematical revenue equations for each major sector of the esports industry, resulting in a more accurate picture of the esports market size ($24.9B USD).
- Game publishers control esports revenues, which is estimated at 64% of esports industry revenues.
Introduction
Not to be confused with recreational video gaming for the sole purpose of leisure, esports is organized competitive video gaming commonly played via a computer, gaming console, or mobile device (Jenny et al., 2017). Viewership and revenue growth of the esports industry has risen year-after-year since at least 2015 (Sjöblom et al., 2019). Scholars and reporters cite many different explanatory factors when describing the growth of esports and its increasing market size (Table 1).
Table 1 - Example topics used to highlight esports market size and growth
| Example |
|---|
| Amount of prize purses for esports events (Gawrysiak et al., 2020) |
| Branding through esports and sponsorships moving from endemic to non-endemic sponsors within esports (Gawrysiak et al., 2020) |
| Celebrity investors in esports, such as David Beckham (Fitch, 2020) and Michael Jordan (Clarke, 2019) |
| Comparison of viewership statistics of esports versus traditional sports spectators (Bitkraft, 2017) |
| Esports and its possible inclusion in the Olympic Games (Jenny et al., 2017) |
| Esports consumer demographics, including the percentage of people who play esports, audience geographies, and percentage of male versus female players (Bitkraft, 2017) |
| Estimated gross revenue of the esports industry (Newzoo, 2020) |
| Growing acceptance of esports as a “sport” in society (Jenny et al., 2017; Walton et al., 2020) |
| Growth of collegiate esports, including “varsity sport” status, esports scholarships, and National Association of Collegiate Esports (NACE) member institutions (Keiper et al., 2017; Williams et al., in press) |
| Growth of esports venues (Jenny et al., 2018) |
| Growth of esports leagues and tournaments worldwide, including franchised leagues (Sholz, 2020) |
| Growth of institutionalization and professionalization within esports, including governing body and player union establishment (Pizzo et al., 2019) |
| Motivations for why people watch or play esports (Bányai et al., 2018) |
| Number and growth of esports viewership, including live events and online streaming (Jenny et al., 2018) |
| The SCAR framework (Skill, Community, Accessibility, Reward) for catalytic growth factors in esports (Collis, 2020) |
| Traditional professional sports leagues (e.g., Fédération Internationale de Football Association [FIFA], Formula One, National Association for Stock Car Auto Racing [NASCAR], National Basketball Association [NBA], National Football League [NFL]) partnering to create electronic sports leagues or hosting major esports tournaments of their sport (Sturm, 2019; Zagala & Strzelecki, 2019) |
The purpose of Table 1 is not to supply an exhaustive list of every statistic available regarding the growth and size of the esports industry. These statistics can be found in the literature review of numerous esports academic papers and market reports, many cited within Table 1 itself. Instead, the purpose of Table 1 is to provide context as to the types of factors that are currently influencing esports revenue and market growth. In turn, to fully understand this growth, an accurate estimate of the true market size and revenue potential of esports is of vital importance.
Defining industrial boundaries can be difficult, particularly regarding esports. Proposed by Newzoo (2020), a commonly accepted figure across the literature is that in 2019 the esports industry was a $1.1 billion (B) United States dollar (USD) market (e.g., Atalay & Boztepe, 2020; Koch, 2019; Reisinger, 2019; Takahashi, 2020). However, upon closer inspection, this figure may be spurious. The popular esport Fortnite alone publicly reported $1.8B in 2019 revenues (Liao, 2020). How is it possible that a single esport grossed nearly twice the entire esports industry? Moreover, the reported investment size of close to $1B annually in esports (Azevedo, 2018) suggests something different. These logical and intuitive gaps are explained by Newzoo (2020)’s narrow definition of esports revenue. Their revenue calculation methodology is as follows:
“We define [esports] industry revenues as the amount the industry generates through the sale of sponsorship deals, media rights, digital, streaming, tickets and merchandising, and publisher fees. Currently, only teams account for digital revenues…Our revenue numbers exclude prize pools and player salaries…The revenue numbers also exclude fan contributions to prize pools...Finally, we do not include capital investments in esports organizations…” (Newzoo, 2020, p. 15)
Thus, Newzoo (2020) primarily extracts their market revenue figure through event and media driven sources, such as ticket sales and sponsorships. Furthermore, to our understanding their methodology also excludes all direct-to-consumer publisher revenues. The only publisher revenues included in Newzoo’s (2020) calculations are “Publisher Fees,” amounting to just $95.2 million (M) in 2019. Because of Newzoo’s (2020) narrow definition of esports revenues, we believe their market size is more accurately described as an “esports events market size.” Newzoo’s approach might be analogous to sizing the American football industry by only counting in-stadium sales; methodologically consistent, but restrictive. Accordingly, $1.1B likely significantly underestimates what we intuitively understand to be the value of the esports industry. Thus, our contributions to the literature are as follows.
First, we propose a broader definition for the esports industry based upon Collis’ (2020) Entire Esports Ecosystem model which breaks esports revenues into six categories: (a) Teams, Professionals, and Streamers, (b) Game Publishers, (c) Streaming Platforms, (d) Physical Products, (e) Leagues and Tournaments, and (f) Digital Tools. The definitions of each category will be provided in greater detail further in this paper. As reflected in the model’s name, these sectors comprise an “ecosystem” of overlapping actors, all of which fundamentally represent esports in some manner. We note that our breakdown is fully inclusive of Newzoo’s revenue methodology, yet more comprehensive.
Second, we describe the business models and value chains of the actors in these different categories. These models are codified and represented in mathematical formulae, which provides the foundation for our esports market sizing estimates. To our knowledge, no other author in the literature has provided such a breakdown of the taxonomy of esports value providers.
Third, we provide an updated estimation of the size of the esports industry. As a result of our expanded methodology for defining esports revenue, we calculate a significantly larger market size for the esports industry compared to Newzoo. Specifically, we find a total market size of $24.9B compared to Newzoo’s (2020) estimate of $1.1B. We believe this figure is a more accurate estimate of the esports industry’s scope, and better explains the prevalence of the esports market size and growth factors outlined in Table 1, as well as including a broader mindshare of esports in popular culture. In comparison to the global economy, this annual global esports economic contribution is estimated to be larger than many countries’ gross domestic product (GDP), including Trinidad and Tobago, Mongolia, and Jamaica (World Population Review, 2020).
To be clear, the findings of this paper do not suggest that Newzoo’s (2020) published reports and statistics are methodologically inconsistent or incorrect. Furthermore, we do not assert that our findings are the definitive or are the only appropriate method for sizing the esports industry. Due to the complexity of the industry and the high number of different business models, this paper itself is necessarily a simplification of the ecosystem, requiring significant assumptions (noted throughout the text). Rather, this paper merely proposes an alternative definition of esports revenues and its associated market sizing. However, we feel this broader definition of esports is of significant academic value, as it calculates a much larger market size for esports using (what we feel to be) a more intuitive scope of the esports industry.
As will become evident, our methodology includes all publisher revenues related to esports games in the market size of esports. This includes physical copy or initial download sales (the revenues attributable to the first purchase of a game), microtransactions sales (the revenues attributable to in-game purchases made by consumers, including those revenues from both cosmetic purchases (so-called ‘skins’) and gameplay enhancing purchases (so-called ‘downloadable content’, or ‘DLC’), and subscription revenues (the revenues attributable to recurring payments made by consumers to game publishers for continued access to esports games or services). Furthermore, our methodology also includes tournament prizing, player and streamer salaries, and esports streaming game video content (GVC) revenues in our market sizing. As such, we believe our broader definition more accurately reflects the true scope of the esports industry.
Entire Esports Ecosystem (EEE)
The “Entire Esports Ecosystem” (EEE) model proposed by Collis (2020) maps all esports businesses into one of six categories. Based on this EEE model, we subdivide the esports industry into the following sectors (Table 2):
Table 2 - Entire Esports Ecosystem| Esports Sector | Sector Abbreviation | Sector Description | Examples |
|---|---|---|---|
| Teams, Professionals and Streamers | TPSs | Includes esports teams, professional players, and esports video game streamers. These are all entities that develop GVC, interact with fans, develop brand power, and collect sponsorships and prize money. |
|
| Game Publishers | GPs | Firms that provide the funds to develop video games and collect revenues directly associated with the game (i.e., price of game, ingame microtransactions, subscriptions). |
|
| Streaming Platforms | SPs | Firms that provide the two-sided streaming interface allowing PTSs to broadcast GVC for viewers to consume. |
|
| Physical Products | PPs | Firms that sell physical gaming products directly to gamers that are used for enabling or enhancing the gaming experience. |
|
| Leagues and Tournaments | LTs | Entities that provide the infrastructure, promotion, and organization for professional players or streamers to compete in a structured esports environment. |
|
| Digital Tools | DTs | Firms that provide digital gaming products for TPSs to operate effectively, communicate, or improve gaming performance. |
|
Of note, the first four sectors listed in Table 2 (TPSs, GPs, SPs, and PPs) all have data sources, revenue, and other figures collected by industry sources that can be used to calculate estimations for associated revenue. However, for the remaining two sectors (LTs and DTs), data remains sparse. Thus, only educated hypothesized limited estimates can be made for these sectors.
Figure 1 shows a simplified model of the flows of value in the esports economy. There are two core drivers behind the esports industry – “Players” (i.e., gamers) and “Viewers” (i.e., spectators). Players primarily purchase gaming content from GPs and goods from PPs, while Viewers mainly consume GVC through SPs and provide other direct revenue to LTs and TPSs. Both groups consume DTs. The unique critical driving factors behind the value of esports lie in the connection between Players and Viewers. As Players play their game of choice continually, many of them also watch (i.e., View) streamers and professionals who provide high-skill, entertaining gameplay of these games in a friendly, accessible manner (Hamari & Sjöblom, 2017), switching with some unknown probability with value P(Watch|Play). In turn, those who watch streamers are encouraged to play the games these influencers are playing (Jang & Byon, 2019), and begin playing with some other unknown probability with value P(Play|Watch). This number will become significant in our analysis of various esports business models below.
Figure 1 - Esports economy value flows model
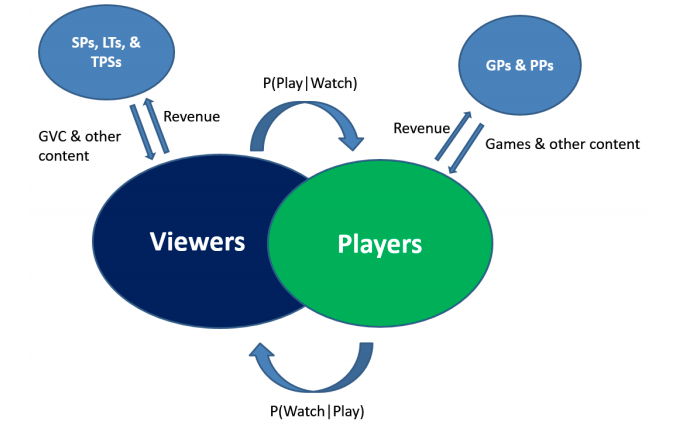
Note. GPs = game publishers; GVC = esports streaming game video content; LTs = leagues and tournaments; PPs = physical products; P(Play|Watch) = probability of a viewer of a particular esport also playing that esport; P(Watch|Play) = probability of an esport player also viewing others play that esport; SPs = streaming platforms; TPSs = teams, professionals, and streamers. See Table 2 for sector description.
Further, investment into either playing a game or watching a streamer deepens the particular Viewer’s investment and incentivizes their jumping back and forth between playing and watching (Johnson & Woodcock, 2019). These investments run the gamut from emotional (i.e., “I want to get good at this game” or “I love this streamer and want him/her to be more successful”) to material (i.e., those watching streamers may be gifted free digital bonuses in various games, and playing specific games often give stream bonuses promoting streamer interaction or streamer success) (Chen & Xiong, 2019).
Moreover, successful GPs, PPs, and SPs should be well aware of the power of TPSs to catalyze their product sales, and regularly sponsor TPSs with exclusive streaming deals, buying advertising space, and other value transfers to have TPSs promote their goods (Gawrysiak et al., 2020). TPSs showcase, use, or otherwise promote the sponsored product, encouraging their audience to purchase this good and imitate their particular style. As the industry develops, such “value transfer” payments may occur directly between GPs and SPs to encourage streaming platform retention, and for TPSs to begin demanding timed exclusive access to certain games in exchange for a return the value transfer.
As such, the analysis within this current paper focuses on determining these primary probability estimates, industry sizing, and implications for businesses who are seeking to enter this industry. Each of the aforementioned esports business sectors listed in Table 2 will now be discussed in relation to industry revenue generation. A simplified equation is also provided for each sector which then results in a more refined 2019 esports industry revenue size estimate, totalling $24.9B (see Figure 2).
Figure 2 - Total esports market revenue size estimate per sector in 2019 (Total: $24.86B USD)
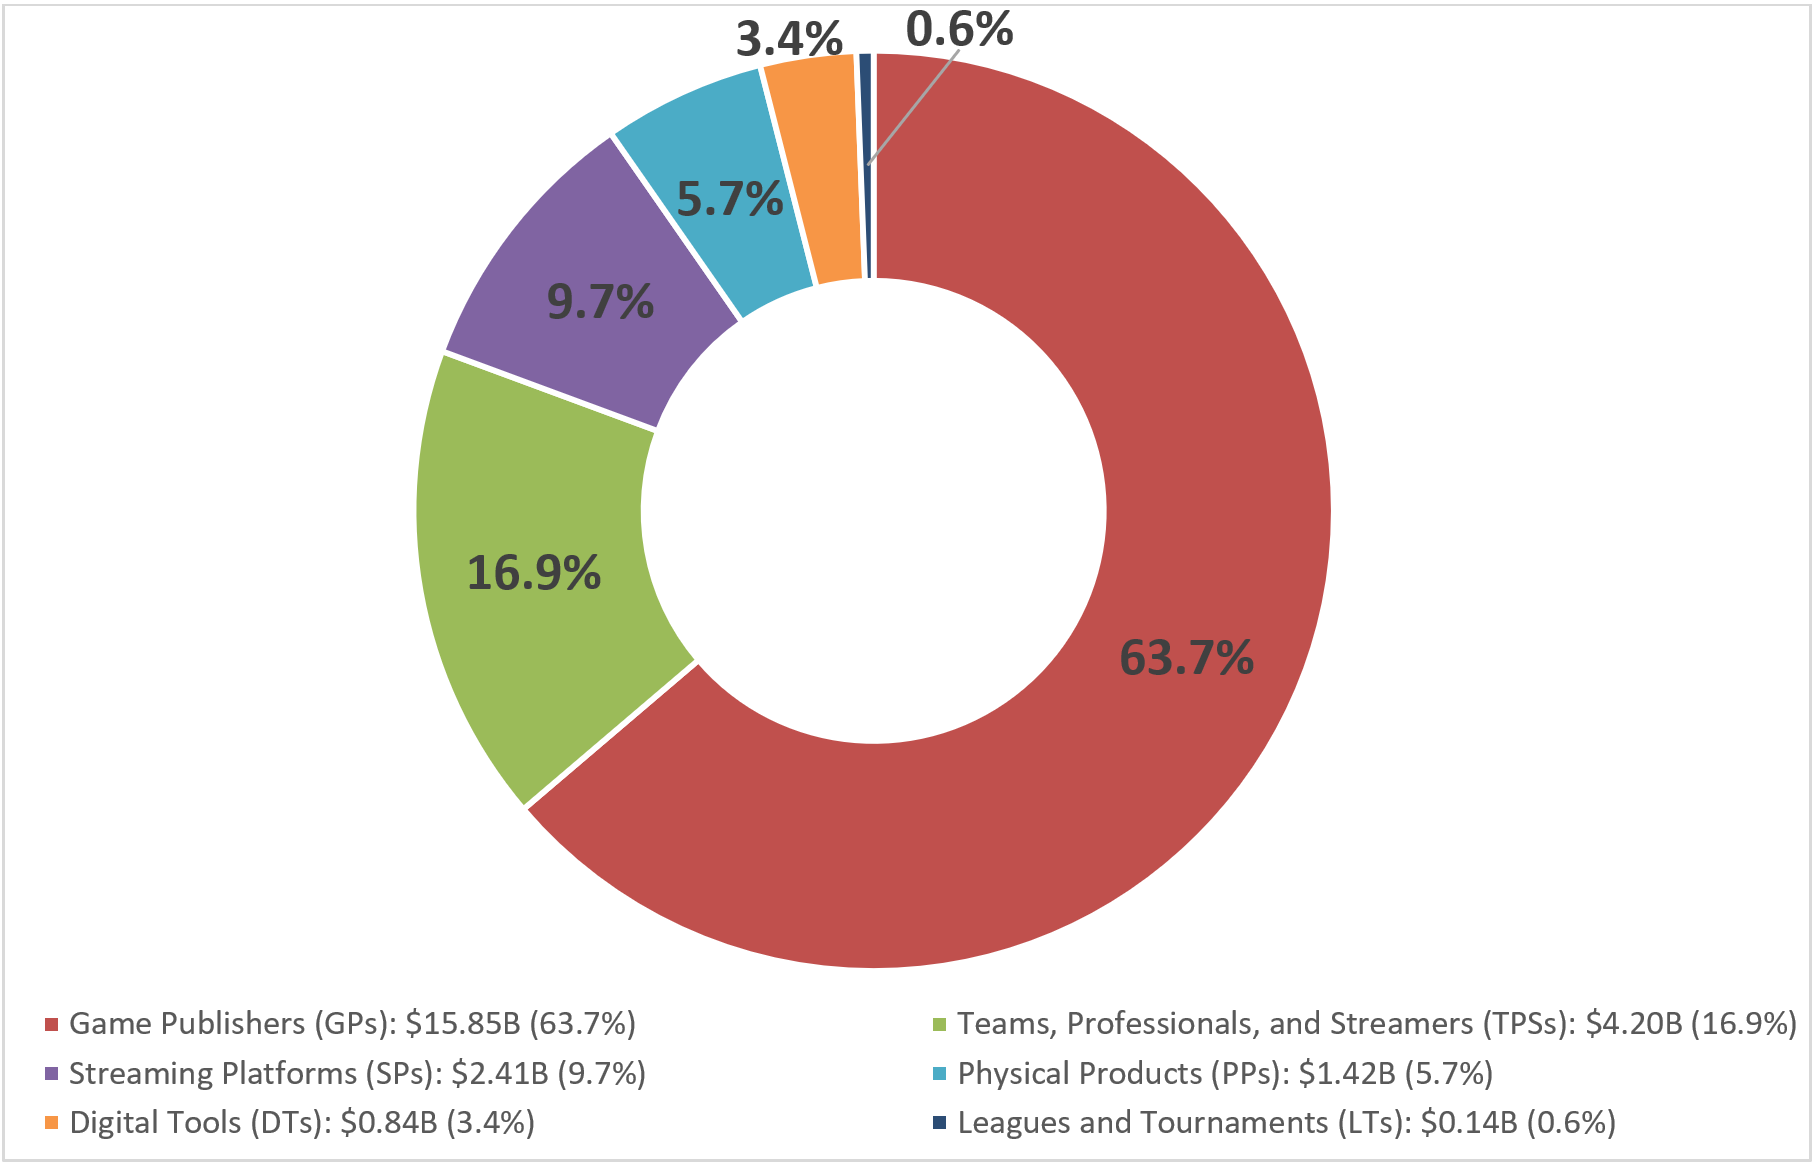
Note. B = billion. USD = United States dollars.
Discussion
The following discussion now sheds light on how each sector’s estimated revenue calculations were performed as seen in Figure 2.
Teams, Professionals, and Streamers (TPSs)
As described above, TPSs provide a critical advertising function for various providers of gaming-related content and products. As such, their revenues primarily derive from firm-level transfers such as sponsorships, exclusivity deals, advertising, and direct prize-pool winnings from tournaments (which can be thought of as value transfers from tournaments in return for participation). Of note, streamers can gain a significant revenue stream from direct contributions from fans in the form of “subscriptions” and direct donations. This is primarily captured in the SPs section later.
For a particular TPS, their profit function can be described as follows (Equation 1):
Equation 1 - Team, professional, or streamer profit equation$$ \Pi_{TPS} = \sum_{game\space i} (N_{viewers,i} * (P(play|watch) * P_{average,i} + P_{donation,i}) + \Pi_{winnings,i}) - C_{tools} $$
Note. \(\Pi_{TPS} \) = TPS profit; \( \sum_{game\space i} \) = total sum over all games, with each game denoted by a given number \( i \); \( N_{viewers,i} \) = number of viewers for the particular TPS for a given game \( i \); \(P_i\) = average price paid for the game; \( P(play|watch) \) = conversion probability that someone who watches the game plays it as well, or will play it; \( P_{average,i} \) = expected revenue per player of the game (from microtransactions, expansion packs, etc.); \( P_{donation,i} \) = average donation per viewer for a specific game; \( \Pi_{winnings,i} \) = prize winnings for a TPS for a game; and \( C_{tools} \) = total tools cost for a TPS (including games, various ancillary hardware, and software tools). Altogether, \( C_{tools} \) is a small percentage of the revenue earned by the TPS.
The above equation captures the following business model: TPSs earn revenue either due to their viewers from donations or advertising, or due to esports winnings, while their outlay is primarily tools, such as games and streaming hardware. As winnings are a function of individual LTs, but not always directly correlated to LT viewers or donations, we treat this amount as exogenous (i.e., a variable whose value is determined outside the model but is imposed on the model). Total esports prizing was $228M in 2019 (Esports Earnings, 2020).
The majority of TPSs revenue derives from donations, subscriptions, advertising, and sponsorships. TPSs gain revenue from two sources: directly from Viewers in the form of donations and subscriptions, or from advertising payments from GPs, PPs, or DTs. These companies pay TPSs to advertise their products or services to their viewership audience. As such, the critical element that secures advertising and sponsorship revenue is the combination of the TPS’ viewership population and the TPS’ potential ability to convert them into Players, who buy products and services from the GPs, PPs, and DTs.
Given an estimate of $6.5B of GVC-related media revenues in 2019 (SuperData, 2020) and percentage splits determined by SuperData (as cited by WePC, 2020), we estimate that across GVC-related media, $3.97B worth of revenue derived from advertising, $1.11B from donations, $845M from subscriptions, and $455M from sponsorships. These statistics utilize the most recent percentage breakdown estimations available (2017).
While TPSs collect their donation and winnings revenues directly, advertising and subscription revenues are typically split with their SP in some ratio. According to SP giant Twitch (2019), approximately 50% of subscription and advertising revenues are split with the SP. Overall, encompassing 50% of advertising, 50% of subscription, all of donation, sponsorship, and winnings revenues, our estimate for the industry size of this TPSs sector of esports is shown below:
$$ 0.5*$3.97B + 0.5*$845M + $1.11B + $455M + $228M = $4.2B $$Conversion probability and other estimates
What is the actual value of (𝑝𝑙𝑎𝑦|𝑤𝑎𝑡𝑐ℎ)? This number, which we will call the conversion probability, is not directly measurable. However, we can extrapolate from industry statistics. We can calculate the average industry-wide conversion probability from: (a) the average advertising spend (by GPs, PPs, and DTs) per player, (b) the total number of viewers of GVC, (c) and the total revenues earned by TPSs from sponsorship and advertising payments from various gaming product producers. Essentially, we are asking: “What average conversion probabilities would drive the spending that we currently observe in the TPS sector?” Our reasoning is as follows: firms that buy advertisements or sponsorships should be incentivized to pay only up to the amount that their sales increase, or in other words, advertising spend on GVC should be at most the value generated by TPSs. As such, we calculate this in Equation 2, which captures the extra revenue for GPs, PPs, and DTs generated by a TPS.
Equation 2 - TPS Gaming video content-related advertising spend equation$$ P_{advert} = P(play|watch) * P_{average} * N_{viewers} $$
Note. \(P_{advert}\) = total advertising spending on GVC-related media; \(P(play|watch)\) = conversion probability of someone watching a game turning to playing a game; \(P_{average}\) = average revenue per Player (not viewer); \(P_{viewers}\) = number of Viewers, as above.
We lack an industry estimate of worldwide GVC viewership in 2019, and so instead estimate worldwide viewership population in 2019 by applying the same growth rate from 2017 to 2018 to 2018 figures. According to SuperData (2020) reports, there were 666 million viewers of GVC in 2017, and 850 million in 2018, leading to an estimated viewership population of 1.085B worldwide. Industry estimates give an average spend of $55.16 per player per year (Sobolev, 2020). Again, as 2019 estimates are not available we use the 2018 figure.
In other words, we estimate \(P_{advert}\) = $3.97B, \(P_{average}\) = $55.16, and \(N_{viewers}\) = 1.085B. From this we can deduce an average viewer-player conversion rate (i.e. \(P(play|watch)\)) of approximately 6.63% for TPSs for such advertisements. This does not necessarily reflect the actual advertising revenue received by the TPS. While this figure may appear surprisingly low, these figures are actually reflected in recent concerns that Twitch and other SPs are not maximizing their value-add or value capture (Perez, 2020). As will be shown, PP conversion rates are similar.
We apply the same logic to sponsorship spending to deduce the average viewer-player conversion rate for PPs (which are the firms that typically sponsor TPSs). We estimate a $6 average player spend on PPs, which is calculated by dividing $13B of gaming hardware spend in 2016 with approximately 2 billion gamers that year. More recent estimates could not be found. Combined with $455M in total sponsorship spend and a viewership population of 1.085B worldwide, an average viewer-user conversion rate of 6.99% can be deduced for sponsorships.
Finally, we calculate the average donation (and subscription revenue) per viewer. Combining donations and a 50% share of subscription revenue (as assumed above) under direct streamer revenue (Twitch, 2019), we can calculate:
\(0.5*$845M + $1.11B = $1.535B \) for 1.085 billion viewers, we can calculate \(P_{donation} = $1.41 \)
Game Publishers (GPs)
GPs provide the core game platform (e.g., video games, consoles) with which TPSs generate their GVC, as well as organize or approve many leagues or tournaments that esports structures entail. Beyond the “core” competitive esports environment, numerous recreational players also purchase these games and play them for their own entertainment. We describe the esportsrelated profit function of GPs as follows (Equation 3):
Equation 3 - Game Publisher profit equation$$ \Pi_{GP} = \sum_{game\space i} (N_{players,i} * (P_i + P_{tail,i}) - (C_i + C_{tail,i}) - C_{market,i}) $$
Note. \(\Pi_{GP}\) = Game Publisher profit; \( \sum_{game\space i} \) represents the total sum over all games, with each game denoted by a given number \(i\); \( N_{players,i} \) = number of players for a given game \(i\); \(P_i\) = average price paid for the video game; \( P_{tail,i} \) = ancillary revenue for the game (such as microtransactions, expansion packs, etc.); \( C_i \) = development cost of the game; \( C_{tail,i} \) = development cost of the tail content; \( C_{market,i} \) = marketing cost of the game. This marketing cost includes value transfers to TPSs to promote a particular game over a fixed time period.
The above equation captures how GPs derive revenue from direct game sales as well as ancillary “tail” revenue, which includes microtransactions, expansion packs, etc. In order to generate revenue, GPs spend on development and marketing costs.
Esports titles typically have very long tails – i.e., where the \( P_{tail,i} \) is high (i.e., ancillary revenue for games, such as Fortnite, League of Legends, Counter Strike: Global Offense, Overwatch, etc.), while \(P_i\) (i.e., the average price paid for the video game) is typically low (e.g., often zero). These pricing mechanisms are designed to maximize tail revenue and are known as “free-toplay”. These titles encourage continuous engagement with the content, and often prominently display the SCAR factors from Collis (2020) listed (Table 3). These factors incentivize longterm engagement by offering gaming that is “easy to pick up, difficult to master.”
Table 3 - SCAR factors that facilitated the rise of esports.| Factor | Meaning |
|---|---|
| Skill | Ability and extensive practice required to successfully play the game |
| Community | The support garnered from the game’s inventors and followers |
| Accessibility | The obstacles to buy and learn the game |
| Reward | The benefits received for being successful at the game. |
On the opposite side are single-player games, typically offering a linear, narrative experience that can typically be completed in 10 to 20 hours. These games typically have lower tail revenue, and low engagement after the initial release date (Fahey, 2017). Exceptions exist of course, including the continued success of Grand Theft Auto (GTA) V and Witcher III. GTA V’s tail is astonishing, but could be attributed to their “GTA Online” feature (Rockstar Games, 2020), which exhibits many esport-like characteristics.
We characterize GP esports revenue as deriving from these kinds of long-tail games, and thus include all primary and tail revenue as included within this industry. We thus separate esport from overall gaming revenue on a game-by-game basis. The distinction between esports and recreational video games can be sometimes difficult to define, but we have made an effort to include a preliminary list of the top games that qualify as esport off of the top 10 esports on Twitch for 2019 (ISPO, 2019; Miceli, 2019).
Our estimate of esports-related publisher revenue is $15.85B in 2019 (Table 4). We deduce this from a simple bottoms-up estimate of the top esports, taking the top 20% of revenue-bearing esports and assuming an 80-20 Pareto ratio (future extensions will include some manner of Power Law ratio estimation and more accurate assessments of the top percentages) for lesspopular “tail” esports games (Hershey, 2019).
Table 4 - 2019 Esports Game Publisher revenue estimates| Esports Game(s) | Year Data Available | Game Publisher | Revenue Estimate (USD) |
|---|---|---|---|
| Call of Duty, Overwatch, Hearthstone, Starcraft II | 2019 | Activision-Blizzard | $5.0B |
| Fortnite | 2019 | Epic Games | $1.9B |
| League of Legends | 2019 | Riot Games | $1.5B |
| CrossFire | 2018 | Smilegate | $1.3B |
| PlayerUnknown’s Battlegrounds / Apex Legends | 2019 | PUBG Corporation / Electronic Arts | $1.08B |
| CS:GO, Dota 2, Team Fortress 2 | 2019 | Valve Esports | $1.2B |
| Rainbow Six Siege | 2019 | Ubisoft | $0.44B |
| World of Tanks | 2017 | Wargaming | $0.475B |
| “Tail” esports games | 2019 | n/a | $2.77B |
|
|
|
Total: | $15.85B USD |
Note. B = billion; CS:GO = Counter-Strike: Global Offensive; USD = United States dollars. Debatably non-esports games Diablo 3 and World of Warcraft was removed off of ActivisionBlizzard’s 2019 revenue estimate. Sources: ISPO, 2019; Miceli, 2019; Hershey, 2019; Spangler, 2020.
Streaming Platforms (SPs)
SPs fundamentally derive their value from the number of viewers on their platform. This analysis is relatively straightforward as their business models are intimately related to the TPS revenue, and derives mainly from collecting a portion of advertising spend and subscription revenue. In other words, they function primarily as a conduit between TPS, viewers, and firms purchasing advertising space. As such, much of the discussion has already been covered above in the TPS sector discussion in turn enabling the SP profit function to be calculated (Equation 4):
Equation 4 - Streaming Platform profit equation
$$ \Pi_{SP} = \sum_{streamer\space j} (N_{viewers,j} * P_j - C_{market,j}) - C_{development}) $$
Note. \(\Pi_{SP}\) = SP profit; \(\sum_{streamer\space j}\) represents the total sum over all streamer, with each streamer denoted by a given number \(j\); \(N_{viewers,j}\) = number of viewers for a particular streamer \(j\); \(P_j\) = average portion taken from the subscriptions and advertising payments for a particular TPS; \(C_{market,j}\) = value transfer from the SP to the TPS to incentivize streaming on the platform; \(C_{development}\) = development and maintenance cost for the platform itself.
The above equation captures how SPs generate revenue from viewers of their GVC content, who spend on subscriptions and are exposed to advertisements. SPs outlays are in development costs \(C_{development}\) for their platform (or other costs, such as analytics, etc.) and \(C_{market,j}\) , or payments to TPSs to stream on their particular platform.
Thus, \(C_{market,j}\) is a function of how “loyal” a particular TPS’s viewers are. This is a relatively new phenomenon, rising primarily after the establishment of significant SP competitors to Twitch such as Caffeine, Facebook Gaming, Trovo, and previously Mixer. For example, prior to Mixer recently announcing a partnership with Facebook Gaming (Warren, 2020), the SP company tendered significant payments to famous streamers such as Ninja and Shroud to stream exclusively on its platform. However, due to the current lack of data and the relative novelty of this phenomenon, we will not analyze the dynamics of the SP-to-TPS value transfers at this time.
The overall revenue of SPs thus derives from the advertising and subscription spending that is not passed on to the final TPS. Based on the advertising and subscription spend we generated in the TPS section, we can calculate total revenues of $2.41B for SPs in 2019:
$$ 0.5*$3.97B + 0.5*$845M = $2.41B $$From a single company’s perspective, this estimate roughly accords with the $0.97B that Amazon had paid for Twitch (assuming appropriate multipliers and the smaller share of the GVC space owned by Twitch versus YouTube), and with the recent news that Twitch is not performing as highly as Amazon had anticipated. Amazon itself projected $300M in advertising revenue for Twitch in 2019 (Perez, 2020).
Physical Products (PPs)
The business model of PPs is straightforward as they sell physical goods to gamers, and tender advertising and sponsorship payments to TPSs via SPs. PPs profit can be calculated through the following (Equation 5):
Equation 5 - Physical Product firm profit equation
$$ \Pi_{PP} = N_{gamers} * P - C_{market} - C_{goods}) $$
Note. \(\Pi_{PP}\) = PP profit; \(N_{gamers}\) = available market of gamers; \(P\) = expected price per gamer (this would be less than full price, as it is the expected price incorporating those who skip purchases); \(C_{market}\) = advertising, sponsorship, and other “value transfer” to TPSs; and \(C_{goods}\) = manufacturing and development cost.
The above equation represents perhaps the most classic business model seen thus far. PPs sell products to gamers and spend on marketing and cost of goods.
We have already explored the extent of value transfers received by TPSs from PPs in the TPS section. From the numbers introduced there, we have an estimate of the size of this market as $13B as of 2016, which we inflation-adjust to approximately $13.6B for 2019. However, it would be inaccurate to characterize all hardware revenue as corresponding to esports, so as a crude measure of esports-related PP revenue we calculate the ratio of esports to total gaming revenue and multiply that to the total inflation-adjusted hardware revenue.
Given that total gaming revenue was $152.1B in 2019 (Wijman, 2019) and given our estimate of $15.85B for esports-related revenue, we calculate a ratio of 10.42%. When applying this to the inflation-adjusted hardware market, we get an estimate of $1.42B in esports-related PP revenue in 2019. As discussed above, estimates for DT and League revenue are more difficult to the sparseness of data and limitations of industry size. Nonetheless, we present our conceptualization of their business models and some revenue estimates drawn from disparate sources.
Digital Tools (DTs)
DTs, as described above, are the “connective tissue” that allow TPSs to operate effectively. Many such DTs are also open-source or free, such as OBS Studio or Discord. Their primary revenues tend to derive from the larger population that uses the software, often imitating trendsetters such as TPSs (Equation 6).
Equation 6 - Digital Tool firm profit equation
$$ \Pi_{DT} = N_{gamers} * P - C_{development} $$
Note. \(\Pi_{DT}\) = DT profit; \(N_{gamers}\) = available market of gamers; \(C_{development}\) = development cost; \(P\) = expected price paid per gamer (for software such as Discord, this takes the form of subscriptions, emotes, and other tail revenue. For open-source software, there is no revenue).
DTs also have a basic business model: they spend on development and sell to gamers. However, this may not remain the case for long, as we will discuss.
Revenue estimates are missing for software even for highly-used tools such as Discord; however, interestingly, Discord once pursued a transition into becoming a two-sided publishing platform such as the Epic Games Store or Steam, offering a “Discord game store” with a highly attractive (for GPs) 90:10 split (Matney, 2018). In the near future, DTs may split into two categories; one section merging with GPs or other gaming stores and another remaining free-to-use tools with long-tail subscription monetization.
To estimate this market size, we take Steam Workshop (i.e., a popular GVC and related tools platform) revenues of $228M as a proxy for the value of digital product enhancements to games offered across the Valve ecosystem. Taking the ratio of Valve’s total revenues that constitute esports revenue, identifying the amount of Steam Workshop revenue that is esports-related (a ratio of $1.2 to $4.3B), and then re-scaling it across the esports Publisher revenues of $15.85B as calculated above – resulting in a total potential value for this market of $840M.
Leagues and Tournaments (LTs)
LTs are the setting in which esports professionals distinguish themselves and compete for prize money. Despite the centrality of these endeavors in the esports space, LTs currently have relatively low revenue capture themselves and instead they primarily operate as conduits or venues to distribute prize money, attract viewers for advertising and sponsorship revenue, and introduce audiences to new TPSs. LTs themselves do keep a small portion of the revenue that passes through, but not in large amounts. For example, industry sources report some successful professional teams not taking any revenue share at all, due to the power of talent in extracting performance bonuses (Maloney, 2020). A large portion of esports LT sector went out of business in the mid-2000s, and other competitors were acquired or managed to earn some limited revenue (Dave, 2015).
LTs also do enjoy franchising revenues, which can be substantial in any given year. Historically, the esports industry averages at least one new franchise each year, and we expect this trend to continue for the next several years while the industry continues to grow and mature. Therefore, we also include a fixed franchise term, T, equivalent to the average annual franchise fees paid per year in esports (estimated at $175M), enabling LTs profit to be captured (Equation 7):
Equation 7 - Leagues and Tournaments profit equation
$$ \Pi_{LT} = F(N_{watchers}) - C + T $$
Note. \(\Pi_{LT}\) = LT profit; \(F(N_{watchers})\) = increasing function of the number of viewers and includes ticket sales, pay-per-view rights, merchandise, milestone or other big-dollar payments such as sponsorships. \(C\) = cost of organizing and managing LTs (e.g., renting venues, organizing events, attracting talent, etc.); \(T\) = fixed franchise fee.
Of note, while LTs obviously earn more revenue the more viewers they have, it is unclear how much of this is actually captured by the LTs or in what quantities, particularly since major Leagues such as ESL and Major League Gaming (MLG) are subsidiaries of larger firms. ESL, one of the largest firms in the LTs sector, projected $60M in revenue in 2015 (Dave, 2015), and MLG reported $20M in annual revenue in 2014 (Dot Esports, 2014). Unfortunately, we could not locate more recent, reliable data points. As a simplifying assumption, we take the average value of these two data points as annual revenue per LT; in other words, we estimate the annual revenue of a particular LT as approximately $40 million. Currently, the largest LTs today include ESL, League of Legends Garuda Series [LGS], MLG, Overwatch League, the International, etc. As a very conservative estimate of the number of LTs with revenues in the range of $20 to $60 million, we assume three firms (we know of at least 2, with MLG and ESL, and include one more as a minimum assumption). We then apply an additional 20% growth for long-tail leagues (80-20 rule), for a total value of $144M.
Response to potential critiques
Some may argue that our approach to sizing the esports market is overly broad. We anticipate three potential criticisms of our methodology, and rebut them thusly:
Potential criticism oneIt is overly broad to count all GP revenues from esports titles as esports revenues because this approach does not distinguish between revenues earned from casual players (e.g., those just playing for fun) and revenues earned from competitive players (also called ‘hardcore,’ ‘ladder’, ‘tournament’ or ‘ranked’ players).
Rebuttal - We feel that all revenues generated by a sport should count towards that sport’s market size, regardless of the competitive level of the consumer or the motivating force behind their spending. For example, it is not common practice to separate amateur and professional revenues when sizing the American Football industry, nor any other sports industry we are aware of. Thus, revenues based on the skill level of the esports consumer should not be discriminated. Furthermore, the distinction between “amateur” and “professional” is itself unclear in the esports industry, as all professional players begin as amateurs. Additionally, it can be argued that amateur esports players themselves still play “competitively,” and are often invited to compete in tournaments or other competitive events.
Potential criticism two
It is overly broad to include revenues from cosmetic items in sizing the esports industry because cosmetic items have no gameplay benefit and therefore no impact on competitive play.
Rebuttal - We feel that all spending a consumer makes on an esports game, regardless of whether that spend is to improve competitiveness or for other, more subjective benefits, is revenue attributable to esports. For example, we include apparel sales revenue when sizing American Football. What are cosmetic items if not simply digital apparel, for a digital sport? Furthermore, the boundary between cosmetic and non-cosmetic item purchases is itself not entirely clear. For example, many cosmetic purchases have ‘signaling value’ in games (for example, the purchase of a digital item that requires a certain number of hours of play might signal devotion or skill, while the purchase of a cosmetic item for a particular weapon might signal a preferred playstyle.) Such signaling itself has competitive value (for example, intimidating other players) and therefore even game purchases that appear to be for purely vanity purposes may mask other, ulterior benefits.
It is overly broad to include revenues from certain games, such as Fortnite or Hearthstone, because they are not truly competitive experiences and therefore should not be considered esports.
Rebuttal - The heart of this criticism relates to the lack of a clear universal definition of esports recognized by everyone. In this paper we define esports as organized competitive video gaming (Jenny et al., 2017). It would seem reasonable to follow this more inclusive and relatively accepted version of the term. We believe any game with a significant peer-versuspeer competitive element may be categorized as an esport. After all, an esport is nothing more than an organized, competitive player(s) versus player(s) video game where skill impacts consistent success more than luck. Therefore, all video games with substantial, competitive elements should be esports, at least in principle. Furthermore, relying on the popularity or professional balance of a game to determine its nature as an esport is unauthentic. Is volleyball not a sport, simply because it may not as popular as basketball? In our analysis, we have only included revenues from the largest video games with publisher-supported or endorsed competitive circuits as esports. However, this is an omission of convenience, and, if anything underestimates the total market size of esports.
Limitations and future research
Certainly, it must be recognized that in this paper, due to the complexity of the esports industry (i.e., varied industry business models that can overlap sectors) and some assumptions that have been noted, there may be errors in our results, particular due to the use of estimations in certain analyses. Nevertheless, it is our contention that the esports industry is severely undervalued at $1.1B. In addition, as previously discussed, only estimates are used in this analysis for LTs and DTs for there is no known widely accepted data within these sectors. Moreover, our calculations as well as Newzoo’s (2020) methodology both exclude esports related gambling or betting revenue due to the difficulty of obtaining accurate figures in this area.
Certainly, future research may also look to apply more empirical analysis of these esports market sizing equations to determine their validity. Moreover, regarding value creation, as the esports industry matures, it is likely that TPSs and SPs will increase their bargaining power, gradually increasing their share of the market revenue, and seek greater synergies from owning assets across different sectors. Therefore, a team-analytics hybrid business model may best capture value in the space, allowing for direct participation in viewership-driven revenues (via teams, otherwise difficult to access) while generating broad value capture across the ecosystem through publisher partnership, endemic partnerships and DTs primarily focused on improving conversion efficiencies. An esports analytics firm should seek to exploit and maximize the interplay between TPSs, SPs and GPs; namely, increase 𝑃(𝑝𝑙𝑎𝑦|𝑤𝑎𝑡𝑐ℎ) and 𝑃(𝑤𝑎𝑡𝑐ℎ|𝑝𝑙𝑎𝑦). As 𝑃(𝑝𝑙𝑎𝑦|𝑤𝑎𝑡𝑐ℎ) increases, TPSs become increasingly valuable in generating revenue for GPs, and will earn increasing levels of bargaining power. Future research may empirically test these ideas.
Conclusion
We estimate the esports industry market size at $24.9B USD for 2019. This represents a significantly higher value than the commonly accepted esports industry revenue size of approximately $1.1B. Our figure is merely an estimate meant to stimulate further discussion but does capture several components missing from other market size estimates. According to our analysis, at nearly 64%, it is apparent that GPs currently control the majority of resources, revenue, and assets in the esports space. However, this may not continue to be the case as the industry expands, legal restrictions around “owning” esports-derived content is set, and TPSs and SPs mature. Already we have seen TPSs and SPs grow significantly in the last several years, with an almost 100% increase in valuation year on year (Collis, 2020). Ultimately, the esports industry may be far larger and possibly more economically influential than previously reported, which in turn would explain the rise of esports in both the popular zeitgeist and investment communities.
Conflicts of Interest
No conflict of interest or financial disclosures pertaining to this manuscript exists.
Disclaimer
The views expressed in this article are those of the authors and do not necessarily represent the views of the Executive Office of the President, the Office of Management and Budget, or the United States government.
References
Atalay, A. & Boztepe, E. (2020). An evaluation on e-sports industry and its economic outputs. Journal of Accounting, Finance and Auditing Studies, 6(3), 19-35. https://doi.org/10.32602/jafas.2020.015
Azevedo, M. A. (2018, September 14). Esports continues to go mainstream as funding surges in 2018. Venture. https://news.crunchbase.com/news/esports-continues-to-gomainstream-as-funding-surges-in-2018
Bányai, F., Griffiths, M. D., Király, O., & Demetrovics, Z. (2018). The psychology of esports: A systematic literature review. Journal of Gambling Behavior, 35(4), 351-365. https://doi.org/10.1007/s10899-018-9763-1
Bitkraft. (2017). Esports 101: A deep dive into the world of competitive video games. https://esportsobserver.com/wp-content/uploads/2017/01/Esports_101-whitepaperBITKRAFT.pdf
Chen, Y. & Xiong, F. (2019). The business model of live streaming entertainment services in China and associated challenges for key stakeholders. IEEE Access, 7, 116321-116327. https://doi.org/10.1109/ACCESS.2019.2935005
Clarke, J. (2019, December 23). 20 celebrities and athletes betting big on esports. Gamer One. https://gamerone.gg/20-celebrities-and-athletes-betting-big-on-esports
Collis, W. (2020). The Book of Esports. RosettaBooks.
Dave, P. (2015, October 23). E-sports promoter ESL becomes world’s biggest video-game events company. Los Angeles Times. https://www.latimes.com/business/la-fi-eslesports-promoter-20151024-story.html
Dot Esports. (2014, January 11). 12 years in, Major League Gaming is finally close to profitability. https://dotesports.com/general/news/major-league-gaming-mlg-profitable-81
Esports Earnings. (2020). Overall esports stats for 2019: Top players: Top 100. https://www.esportsearnings.com/history/2019/top_players
Fahey, R. (2017, October 27). The economics of single-player games. GamesIndustry.Biz. https://www.gamesindustry.biz/articles/2017-10-27-the-economics-of-single-playergames
Fitch, A. (2020, June 25). Guild Esports launches with David Beckham as co-owner. Esports Insider. https://www.esportsinsider.com/2020/06/guild-espors-david-beckham
Gawrysiak, J., Burton, R., Jenny, S., & Williams, D. (2020). Using esports efficiently to enhance and extend brand perceptions – A literature review. Physical Culture and Sport. Studies and Research. 86(1), 1-14. https://doi.org/10.2478/pcssr-2020-0008
Hamari, J., & Sjöblom, M. (2017). What is eSports and why do people watch it? Internet Research, 27(2), 211-232. https://doi.org/10.1108/IntR-04-2016-0085
Hershey, W. (2019, September 30). Esports tiers: Understanding the games driving esports. EFT Trends. https://www.etftrends.com/tactical-allocation-channel/investigatevanecks-this-israel-equities-etf
Influencer MarketingHub. (2020). How much do Twitch streamers make? https://influencermarketinghub.com/how-much-do-twitch-streamers-make
ISPO. (2019). Top 10: The most popular esports games on Twitch. https://www.ispo.com/en/trends/top-10-most-popular-esports-games-twitch
Jang, W. W., & Byon, K. K. (2019). Antecedents and consequence associated with esports gameplay. International Journal of Sports Marketing and Sponsorship, 21(1), 1-22. https://doi.org/10.1108/IJSMS-01-2019-0013
Jenny, S. E., Keiper, M. C., Taylor, B. J., Williams, D. P., Gawrysiak, J., Manning, R. D., & Tutka, P. M., (2018). eSports venues: A new sport business opportunity. Journal of Applied Sport Management, 10(1), 34-49. https://doi.org/10.18666/JASM-2018-V10-I1-8469
Jenny, S., Manning, R. D., Keiper, M. C., & Olrich, T. W. (2017). Virtual(ly) athletes: Where eSports fit within the definition of "sport". Quest, 69(1), 1-18. https://doi.org/10.1080/00336297.2016.1144517
Johnson, M. R., & Woodcock, J. (2019). “And Today’s Top Donator is”: How live streamers on Twitch.tv monetize and gamify their broadcasts. Social Media + Society, 5(4), 1-11. https://doi.org/10.1177/2056305119881694
Keiper, M. C., Manning, R. D., Jenny, S., Olrich, T., Croft, C. (2017). No reason to LoL at LoL: The addition of esports to intercollegiate athletic departments. Journal for the Study of Sports and Athletes in Education, 11(2), 143-160. http://dx.doi.org/10.1080/19357397.2017.1316001
Koch, L. (2019, February 5). Esports playing in the big leagues now. eMarketer. https://www.emarketer.com/content/esports-disrupts-digital-sports-streaming
Liao, S. (2020, January 3). Fortnite made $1.8 billion in 2019. CNN Business. https://www.cnn.com/2020/01/03/tech/fortnite-sales-2019/index.html
Perez, M. (2020, January 8). Report: Amazon’s Twitch not meeting ad revenue expectations. Forbes. https://www.forbes.com/sites/mattperez/2020/01/08/report-amazons-twitchnot-meeting-ad-revenue-expectations/#226a9b7c7164
Pizzo, A. D., Jones, G. J., & Funk, D. C. (2019). Navigating the iron curtain: An institutional creation perspective of collegiate esports. International Journal of Sport Management, 20(2), 171-197.
Maloney, T. (2020, February 12). How do esports teams make money? Roundhill Investments. https://www.roundhillinvestments.com/research/esports/how-do-esports-teamsmake-money
Matney, L. (2018, December 14). Discord announces 90/10 revenue split for self-published titles on upcoming games store. Tech Crunch. https://techcrunch.com/2018/12/14/discord-announces-a-90-10-revenue-split-for-theirupcoming-games-store
Newzoo (2020). 2020 Global esports market report. https://newzoo.com/products/reports/global-esports-market-report
Miceli, M. (2019, July 7). Top 10 most-watched Twitch content, first half 2019. The Esports Observer. https://esportsobserver.com/top10-twitch-content-h12019
Reisinger, D. (2019, February 14). Global e-sports market will reach $1 billion in proceeds in 2019. Fortune. https://fortune.com/2019/02/14/global-esports-market-revenue
Rockstar Games. (2020). Grand theft auto online. https://www.rockstargames.com/GTAOnline
Sholz, T. M. (2020). Deciphering the world of eSports. International Journal of Media Management, 22 (1), 1-12. https://doi.org/10.1080/14241277.2020.1757808
Sjöblom, M., Hamari, J., & Jylhä, H. (2019). Gamification group: Esports final report. https://www.tut.fi/Gamification/2019/01/24/esports-final-report/
Sobolev, J. (2020). How much money does the average person spend on video games? Game Shift. https://gamingshift.com/how-much-money-does-the-average-person-spend-onvideo-games
Spangler, T. (2020, January 2). ‘Fortnite’ revenue dropped 25% in 2019 but was still the year’s top-earning game with $1.8 billion haul. Variety. https://variety.com/2020/digital/news/fortnite-top-earning-game-2019-1203455069/
Sturm, D. (2019). Not your average Sunday driver: The Formula 1 Esports Series World Championship. In R. Rogers (Ed.), Understanding esports: An introduction to the global phenomenon (pp. 153-165). Lexington.
SuperData. (2020). 2019 year in review: Digital games and interactive media. https://www.superdataresearch.com/reports/2019-year-in-review
Takahashi, D. (2016, January 4). Activision Blizzard buys MLG for estimated $46M to build ‘ESPN of esports’. GamesBeat. https://venturebeat.com/2016/01/04/activision-blizzardbuys-mlg-for-estimated-46m-to-build-espn-of-esports
Takahashi, D. (2020, February 25). Newzoo: Global esports will top $1 billion in 2020, with China as the top market. GamesBeat. https://venturebeat.com/2020/02/25/newzooglobal-esports-will-top-1-billion-in-2020-with-china-as-the-top-market
Twitch. (2019, October 7). Twitch affiliate agreement. https://www.twitch.tv/p/legal/affiliateagreement
Walton, D. R., Lower-Hoppe, L. M., & Horger, M. (2020). Do esports classify as intercollegiate sport? Legal analysis of Title IX. Journal of Issues in Intercollegiate Athletics, 13, 94-118. http://csri-jiia.org/do-esports-classify-as-intercollegiate-sport-legal-analysis-of-title-ix
Warren, T. (2020, June 22). Microsoft is shutting down Mixer and partnering with Facebook Gaming. The Verge. https://www.theverge.com/2020/6/22/21299032/microsoft-mixerclosing-facebook-gaming-partnership-xcloud-features
WePC. (2020, January). 2020 video game industry statistics, trends and data. https://www.wepc.com/news/video-game-statistics
Wijman, T. (2019, June 18). The global games market will generate $152.1 billion in 2019 as the U.S. overtakes china as the biggest market. Newzoo. https://newzoo.com/insights/articles/the-global-games-market-will-generate-152-1-billion-in-2019-as-the-u-s-overtakes-china-as-the-biggest-market
Williams, D., Tutka, P., Gawrysiak, J., & Jenny, S. (in press). NCAA eSports 20XX: An analysis of radical innovation adoption through firm collaboration. International Journal of Sport Management and Marketing.
World Population Review. (2020). GDP ranked by country 2020. https://worldpopulationreview.com/countries/countries-by-gdp
Zagala, K., & Strzelecki, A. (2019). eSports evolution in football game series. Physical Culture and Sport. Studies and Research, 83(1), 50-62. https://doi.org/10.2478/pcssr-2019-0020