Variables related to the outcome of an eSports professional tournament: case study of 2019 League of Legends World Championship Series
by Adrián Martín Castellanos*, Guillermo Benito CorpsEmail: adrimartincast@gmail.com
Received: 10 Nov 2020 / Published: 13 Sep 2021
Abstract
The aim of this study is to analyse the possible relationships between variables that compose the game and its influence in achieving victory in electronic sports, more specifically in the League of Legends. For this, observation of the 77 games of the final phase of the World Championship Series 2019 was carried out, recording data on variables related to the interactions of the players with the opponents and the map. Results obtained show significant differences on several variables related to team structures, number of deaths, earned gold and neutral map targets, being these structures and squad that got first Baron Nashor factors with a higher ratio as for the team that achieves victory on each side.
Highlights
- Kills, towers, gold, inhibitors, drakes, Baron Nashor and first team to manage Baron Nashor were identified as changing variables according to the winner side.
- Towers, especially those obtained by read team, could be essential to build a game strategy to improve the chance to achieve the victory in international tournaments.
- A longitudinal research is necessary to establish if these variables are equally important with game modifications or in different regions.
Introduction
The video game industry is in a state of development and is experiencing exponential growth for some time now. Since 2013, diverse researchers (Hamari & Sjöblom, 2017; Reitman et al., 2020) have studied the development of the sector’s income, and its population increase. According to these reports, in 2013, more than 70 million people engaged with videogames, and more specifically about its competitive aspect: esports. This increased to 143 million viewers in 2017 (Newzoo, 2017) and it is estimated to reach 250 million spectators in 2021. Despite the clear evidence of the rise of this industry (Yue et al., 2020), there is some controversy regarding the terminology of the area and the framework in which it is established.
The concept of esports has been a topic that has presented disparity in definitions (De Matías, 2014; Hamari & Sjöblom, 2017; Wagner, 2006). According to these definitions the term esport can show different characteristics by gender or videogame. To determine if a videogame is an esport or not, we can draw from series of criteria suggested by De Matías (2014) or Bornemark (2013). Due to this, it is considered necessary to learn about different variables that influence the development and/or outcome of the game. The characteristics and variables that could influence the development of the esport were previously studied, both before and during the game, for evaluative and predictive purposes (Hodge et al., 2017; Yang et al., 2016). Considering the different types of videogames that can be played at a competitive level, as well as the unique characteristics that each one presents due to their typology, there can be various influencing factors, due to the objectives, procedures and situations that arise may or may not be related, even between different eSports within the same genre.
For this study, League of Legends, a Multiplayer Online Battle Arena (MOBA), has been selected as it is one of the most prevalent genre within esports. This selection is based on its follow-up and participation data, achieving the first position in hours watched of live events, and second in terms of hours of game watched not belonging to tournaments (i.e., streamers and content creators; Newzoo, 2020). Several previous studies have attempted to generate predictive knowledge about the development of activities within the MOBA genre, however few examine League of Legends, instead focusing on other games such as Honor of Kings or Dota2 (Aryanata et al., 2017; Yang et al., 2020a; Yang et al., 2020b)
This paper presents the intention of creating knowledge about the influence of victory based upon several variables gathered in-game. Additionally, the relationship between variables and their presence when a team achieved the victory is studied with the purpose of detecting parameters that help us to objectively measure the performance of professional esports teams, in pursuit of the advancement and professionalism within esports.
After significant research, different variables were identified as conditions of the development of the game. These conditions or categories can explain the metagame, which is the way the game can change or be explained through those modifications. According to this, four categories can be identified to explain the metagame (Salen Tekinbas & Zimmerman, 2003, p. 482): what players bring to each game, what players take away from each game, what happens between games and what happens during a game. Related with last category, there are three moments that can be considered as the most influential (Wang, 2018): In-Game factors (Hodge et al., 2017; Yang et al., 2016), Champion Selection Phase (Ong et al., 2015) and Player Performance and Behaviour Analysis (Hodge et al., 2019). Solely In-Game will be study in this paper, for this reason variables which are analysed in this research are the main interactions with the environment and the opponent, picking up variables previously studied, such as gold earned (Gaina & Nordmoen, 2018; Todeschini de Souza & Nogueira Cortimiglia, 2017), kills, structures and neutral objectives (Novak et al., 2019a; Wang, 2018) and adding others that could be important (such as first blood or first tower achievement) or from similar games (Aung et al., 2018). The aim of the study is to define several variables related with League of Legends, and to study the relationship between these variables and victory, focusing on changes produced by the outcome condition, and to generate a predictive model of the winning side based upon these variables.
Methodology
Sample
To carry out this research, the sample collected correspond to the 77 games that composed the final phase of the League of Legends Worlds Championship Series 2019, played in patch 9.191. These games were played by a total of 16 teams from Asia, North America, Europe, and South America, representing the best international leagues after a Play-In process.
In this system, there are 12 teams directly qualified to the final phase of the tournament, according to their position in the regional league; and another 12 teams selected from the minor regions (wildcard) and the teams from large regions, but with a lower score than those directly qualified, compete for 4 places in the final phase of the tournament. In this case, the leagues that obtained representation in the final phase were the LEC (European League), LCS (North American League), LCK (Korean League), LPL (Chinese League), LMS (Taiwan League Macao and Hong Kong) and VCS (Vietnam League).
Regarding variables to be developed within the study, different variables were recorded within each of the games, which have been detailed in the following section.
Variables
The variables examined in this research were focused on the winning team; number of kills by team, total of gold earned by team, objectives achieved from opposite team, first team to achieve a neutral objectives and number of times which they achieved it, type of drakes and times of the main events. The observed variables are exposed on the Table 1.
Table 1 - Definition of variables examined in the study| Variable | Description |
|---|---|
| Phase | Tournament phase in which the game is played (group stage, quarterfinals, semi-finals, finals) |
| Type of match | Format in which the match is played (Best of 1/BO1, Best of 5/BO5) |
| Winner side | Winning team side (Red-Blue) |
| KillsBTeam | Number of blue side kills achieved |
| KillsRTeam | Number of red side kills achieved |
| FirstbloodBR | Team who managed first kill in game |
| TimeFB | Time of first kill |
| TeamFT | Team who destroyed first turret in game |
| LaneFT | Lane of the first turret destroyed |
| Min1Turret | Time of first turret eliminated |
| TurretsDestBT | Turrets destroyed by blue side |
| TurretsDestRT | Turrets destroyed by red side team |
| InhibDestBT | Inhibitors destroyed by blue side team |
| InhibDestRT | Inhibitors destroyed by red side team |
| GoldFinalBTK | Gold earned at the final of the game by blue side |
| GoldFinalRTK | Gold earned at the final of the game by red side |
| FirstDrake | Team who killed first drake in game |
| TimeFD | Time of first drake kill |
| DrakesBlue | Number of blue side drakes managed |
| DrakesRed | Number of red team drakes managed |
| FiredrakeBT | Number of blue side fire drakes managed |
| WaterdrakeBT | Number of blue side water drakes managed |
| EarthdrakeBT | Number of blue side mountain drakes managed |
| AirdrakeBT | Number of blue side wind drakes managed |
| FiredrakeRT | Number of red side fire drakes managed |
| WaterdrakeRT | Number of red side water drakes managed |
| EarthdrakeRT | Number of red side mountain drakes managed |
| AirdrakeRT | Number of red side wind drakes managed |
| ElderdrakeBT | Number of blue side elder drakes managed |
| ElderdrakeRT | Number of red side elder drakes managed |
| HeraldTeam | Side of the team who killed Herald and took it |
| TimeHerald | Time of Herald kill |
| FirstTeamNashor | First team to kill Baron Nashor |
| TimeFirstNashor | Time of first Baron Nashor killed |
| NashorBT | Number of blue side total Baron Nashor killed in all game |
| NashorRT | Number of red side total Baron Nashor killed in all game |
| TimeGame | Total time of the game |
The Rift Herald is a neutral target located in the upper part of the river that divides the field. It appears in the 10th minute of play and remains in this space until the 20th minute that Baron Nashor appears. The player who collects the Eye of the Herald will be able to use it for the next 4 minutes to summon an ally that will launch against the closest target. Baron Nashor is a neutral target on the top of the river that divides the field, being one of the strongest neutral elements. It appears after 20 minutes and gives a reward of empowerment of minions and statistics to the team that defeated it for 3 minutes.
The drake is a neutral target located at the bottom of the river that divides the field. It appears in minute 5 and grants rewards to the team that defeats it depending on the type of drake it is: the water drake grants health regeneration, the earth (mountain) drake grants armor and magic resistance, the fire drake grants attack damage and power of skill and the wind drake grants cooldown reduction on the ultimate ability of each player on the team permanently in the game, thus being able to stack. The Elder Drake appears after the 35th minute and is one of the most difficult neutral targets on the map, standing at the bottom of it, at the same point as the rest of the dragons. The team that defeats it gains true damage and increased other drake stats for 150 seconds.
The towers are structures that protect the lane from the enemy team. Each team has 11 towers. 3 per lane and two in front of the nexus, attacking enemies that approach it. A tower cannot be attacked unless the previous one is destroyed. Inhibitors are structures at the base that protect the nexus. When a team destroys an inhibitor, during the next 4 minutes the nexus spawns super minions and can attack nexus towers and nexus. The nexus is the target to destroy in the game. Located at the base of the team, guarded by two towers. The team that destroys the nexus wins the game.
Process
To collect these data on the variables, an observation of all games of the competition from its official page was carried out(by two independent observers), with a common record form. Then this data was cross-checked to correct possible mistakes (for which a third display was carried out to avoid erroneous data). Once this data collection was completed, the result was compared with the similar database provided by Sevenhuysen (2020) in which information on these variables were collected from RIOT API, with the purpose of triangulating data of these games obtained through two previous steps. This information was obtained from official sources from RIOT Developer Web and was used as the authoritative data in case of a mismatch between authors, except for specific variables such as lane of the first turret destroyed, inhibitors destroyed by blue and red side team and time of Herald kill, which were reviewed to reach an agreement.
Subsequently, the collected data was analysed using the Statistical Package for the Social Sciences (SPSS, IBM Corporation; Armonk, New York) program in its version 25.0. An a priori α level of 0.005 was set for all comparisons to determinate statistical significance. The variables were defined according to their nature and the distribution corresponding to the scale variables was viewed using the Kolmogorov-Smirnov test, meanwhile nominal variables were studied for a frequency distribution.
With all this, and considering these results, an independent t-test was carried out in the case of variables that followed a normal distribution. While, in case of the variables with a nonnormal distribution, a Mann-Whitney U test was performed. In parallel, the relationship between the different nominal variables was observed using Pearson´s Chi - square test, using Fisher´s Exact Test (FET). Several correlations were carried out with Spearman correlation, in order to detect variables with a large correlation and avoid a possible multicollinearity error (Hinkle et al., 1979).
To calculate size effect, different classifications were followed. Cramer´s V was the measure for Pearson´s Chi – square, following Rea & Parker (1992), with an interpretation: <0,1 = Negligible association; ≥0,1 to <0,2 = Weak association; ≥0.2 to <0.4 = Moderate association; ≥0.4 to <0.6= Relatively strong association; ≥0,6 to <0,8= Strong association; ≥0.8 to 1 = Very strong association. Eta squared (\(η_2\)) (Morse, 1999) and d (Cohen, 1988) were considered on each relevant variable.
Finally, a classification and regression tree model (CRT) was, utilising a significance level of p < 0.05, a range of interaction 50 – 25 (maximum – minimum), the improvement measure should be higher than 0.001 and a cross-validation was conducted (the sample was randomly divided into 10 folds), using the 10% of the sample as a test sample.
Results
The frequency of each nominal variable is presented in Table 2 below. Differences were observed in variables related to the team who achieved first drake and destroyed first turret. Red side had greater percentage of victory (51.9%) than blue side (48.1%), and mid turret was eliminated less times than other lines (11.7 %, compared with top 46.8% and bot 41.6%).
Table 2 - Frequency of each nominal variable| B | R | NC | NO | Top | Mid | Bot | ||||||||
|---|---|---|---|---|---|---|---|---|---|---|---|---|---|---|
| N | % | N | % | N | % | N | % | N | % | N | % | N | % | |
| Winner side | 37 | 48.1 | 40 | 51.9 | ||||||||||
| FirstbloodBR | 39 | 50.6 | 38 | 49.4 | ||||||||||
| TeamFT | 34 | 44.2 | 43 | 55.8 | ||||||||||
| FirstDrake | 31 | 40.3 | 46 | 59.7 | ||||||||||
| HeraldTeam | 35 | 45.5 | 40 | 51.9 | 1 | 1.3 | 1 | 1.3 | ||||||
| FirstTeamNashor | 39 | 50.6 | 34 | 44.2 | 4 | 5.2 | ||||||||
| LaneFT | 36 | 46.8 | 9 | 11.7 | 32 | 41.6 | ||||||||
Table 3 shows that the team who eliminated the first Baron Nashor ( \(X^2(2) = 43,44; FET = 48,17; p < .001; V_c = .751) \) was not independent of the winner side. Following Rea & Parker (1992), the team who achieved first the Baron Nashor kill had a strong association with winning team based on the size effect. A higher percentage of victory from blue side was observed when the blue team obtained the Baron Nashor buff first in the game (82,1%), more than was expected by chance. The red team presented a lower percentage of victory (17,9%) when blue team achieved first Baron Nashor. In the case of red team as first squad managing first Baron Nashor, a higher percentage of victory was observed for red team (94,1%), and blue team presented a lower value than was expected (5,9%).
Table 3 - Cross tables with chi-square, degrees of freedom and significance| Winner side | ||||||
|---|---|---|---|---|---|---|
| Variables | B | R | ||||
| N | N | X2 | df | P Value | ||
| FirstbloodBR | ||||||
| Blue | 22 | 17 | 2.21 | 1 | 0.14 | |
| Red | 15 | 23 | ||||
| TeamFT | ||||||
| Blue | 22 | 12 | 6.76 | 1 | 0.01 | |
| Red | 15 | 28 | ||||
| FirstDrake | ||||||
| Blue | 20 | 11 | 5.63 | 1 | 0.02 | |
| Red | 17 | 29 | ||||
| HeraldTeam | ||||||
| Blue | 18 | 17 | 2.01 | 3 | 0.57 | |
| Red | 19 | 21 | ||||
| None | 0 | 1 | ||||
| Not Collected | 0 | 1 | ||||
| FirstTeamNashor | ||||||
| Blue | 32 | 7 | 43.44 | 2 | 0.00 | |
| Red | 2 | 32 | ||||
| None | 3 | 1 | ||||
| LaneFT | ||||||
| Top | 18 | 18 | 0.18 | 2 | 0.94 | |
| Mid | 4 | 5 | ||||
| Bot | 15 | 17 | ||||
Regarding quantitative variables, frequency, standard deviation, mean and normal values are shown in table 4, after Kolmogorov-Smirnov test.
Table 4 - Average and standard deviation with Kolmogorov – Smirnov test| Kolmogorov - Smirnov | ||||||
|---|---|---|---|---|---|---|
| N | M | SD | Z | P Value | ||
| KillsBTeam | 77 | 13.19 | 6.62 | 0.12 | 0.01 | |
| KillsRTeam | 77 | 13.77 | 6.95 | 0.08 | 0.20 | |
| TimeFB | 77 | 05:01 | 02:52 | 0.16 | 0.00 | |
| Min1Turret | 77 | 13:56 | 02:11 | 0.09 | 0.08 | |
| TurretsDestBT | 77 | 6.03 | 3.51 | 0.17 | 0.00 | |
| TurretsDestRT | 77 | 6.22 | 3.88 | 0.19 | 0.00 | |
| InhibDestBT | 77 | 0.84 | 0.95 | 0.28 | 0.00 | |
| InhibDestRT | 77 | 1.08 | 1.21 | 0.23 | 0.00 | |
| GoldFinalBTK | 77 | 59.52 | 12.84 | 0.07 | 0.20 | |
| GoldFinalRTK | 77 | 59.55 | 12.93 | 0.06 | 0.20 | |
| TimeFD | 77 | 08:51 | 02:02 | 0.10 | 0.07 | |
| DrakesBlue | 77 | 1.88 | 1.35 | 0.14 | 0.00 | |
| DrakesRed | 77 | 2.31 | 1.41 | 0.21 | 0.00 | |
| FiredrakeBT | 77 | 0.47 | 0.68 | 0.40 | 0.00 | |
| WaterdrakeBT | 77 | 0.45 | 0.68 | 0.38 | 0.00 | |
| EarthdrakeBT | 77 | 0.58 | 0.78 | 0.37 | 0.00 | |
| AirdrakeBT | 77 | 0.38 | 0.61 | 0.42 | 0.00 | |
| FiredrakeRT | 77 | 0.60 | 0.83 | 0.35 | 0.00 | |
| WaterdrakeRT | 77 | 0.64 | 0.87 | 0.35 | 0.00 | |
| EarthdrakeRT | 77 | 0.58 | 0.77 | 0.35 | 0.00 | |
| AirdrakeRT | 77 | 0.49 | 0.72 | 0.38 | 0.00 | |
| ElderdrakeBT | 77 | 0.09 | 0.29 | 0.53 | 0.00 | |
| ElderdrakeRT | 77 | 0.12 | 0.36 | 0.52 | 0.00 | |
| TimeHerald | 75 | 12:34 | 01:31 | 0.11 | 0.02 | |
| TimeFirstNashor | 73 | 25:19 | 03:32 | 0.11 | 0.02 | |
| NashorBT | 77 | 0.68 | 0.70 | 0.29 | 0.00 | |
| NashorRT | 77 | 0.70 | 0.81 | 0.29 | 0.00 | |
| TimeGame | 77 | 32:39 | 05:56 | 0.08 | 0.20 | |
In the case of the quantitative variables with a normal distribution, results found are shown in table 5. Significant differences were found in the kills achieved by the red team variable \( (t_{75}= 5,89; p < ,001; d = 1,34) \), with a large size effect and final gold achieved by both teams \((B t_{75}= 3,51; p < ,001; d = 0,80 / R t_{75}= 3, 46; p < ,001; d = 0,79)\), with a large and moderate effect size respectively.
Table 5 - T-test for independence sample related with winner side| Winner side | ||||||||||
|---|---|---|---|---|---|---|---|---|---|---|
| B | R | T-Test | Size effect | |||||||
| N | M | SD | N | M | SD | t | df | P Value | d | |
| KillsRTeam | 37 | 9.73 | 6.39 | 40 | 17.50 | 5.17 | 5.89 | 75 | 0.00 | 1.34 |
| Min1Turret | 37 | 13:45 | 02:11 | 40 | 14:06 | 02:13 | 0.70 | 75 | 0.48 | 0.16 |
| GoldFinalBTK | 37 | 64.51 | 10.53 | 40 | 54.91 | 13.17 | 3.51 | 75 | 0.00 | 0.80 |
| GoldFinalRTK | 37 | 54.60 | 12.77 | 40 | 64.14 | 11.43 | 3.46 | 75 | 0.00 | 0.79 |
| TimeFD | 37 | 09:13 | 02:13 | 40 | 08:30 | 01:48 | 1.58 | 75 | 0.12 | 0.36 |
| TimeGame | 37 | 32:45 | 06:03 | 40 | 32:34 | 05:54 | 0.13 | 75 | 0.90 | 0.03 |
With the quantitative variables that did not follow a normal distribution, a Mann-Witney \(U\) test was performed (Table 6) which are compared against the winning team. Variables related to enemy objectives, such as number of turrets destroyed by blue \((Z = 7,44; p < ,001; η_2 = 0,73)\) and red team \((Z = 7,53; p < ,001; η_2 = 0,75)\), number of inhibitors achieved by team (Blue team as winner side \(Z = 7,19; p < ,001; η_2 = 0,68\) and Red team as winner side \(Z = 7,33; p < ,001; η_2 = 0,71 \) ) and number of kills managed by blue side team \((Z = 6,12; p < ,001; η_2 = 0,49)\).
As for neutral objectives, significant differences were found in the number of drakes achieved for each team (\(Z = 5,38; p < ,001; η_2 = 0,38 \) and \(Z = 4,9; p < ,001; η_2 = 0,32 \) for blue and red side as winner teams respectively) and number of Baron Nashor kills by blue \((Z = 6,16; p < ,001; η_2 = 0,50)\) and red side \((Z = 6,78; p < ,001; η_2 = 0,60)\).
Table 6 - Mann-Witney U test between variables with non-normal distribution and winner side| Winner side | Mann - Witney U Test | Effect Size | |||||||
|---|---|---|---|---|---|---|---|---|---|
| B | R | ||||||||
| Variable | N | M | SD | N | M | SD | Z | P Value | \(η_2\) |
| KillsBTeam | 37 | 17.95 | 4.16 | 40 | 8.80 | 5.31 | 6.12 | 0.00 | 0.49 |
| TimeFB | 37 | 05:00 | 03:01 | 40 | 05:02 | 02:46 | 0.42 | 0.67 | 0.00 |
| TurretsDestBT | 37 | 9.19 | 1.24 | 40 | 3.10 | 2.06 | 7.44 | 0.00 | 0.73 |
| TurretsDestRT | 37 | 2.59 | 2.05 | 40 | 9.58 | 1.17 | 7.53 | 0.00 | 0.75 |
| InhibDestBT | 37 | 1.59 | 0.76 | 40 | 0.15 | 0.43 | 7.19 | 0.00 | 0.68 |
| InhibDestRT | 37 | 0.16 | 0.44 | 40 | 1.93 | 1.07 | 7.33 | 0.00 | 0.71 |
| DrakesBlue | 37 | 2.73 | 0.99 | 40 | 1.10 | 1.15 | 5.38 | 0.00 | 0.38 |
| DrakesRed | 37 | 1.49 | 1.35 | 40 | 3.08 | 0.97 | 4.9 | 0.00 | 0.32 |
| FiredrakeBT | 37 | 0.76 | 0.80 | 40 | 0.20 | 0.41 | 3.4 | 0.00 | 0.15 |
| WaterdrakeBT | 37 | 0.62 | 0.79 | 40 | 0.30 | 0.52 | 1.88 | 0.06 | 0.05 |
| EarthdrakeBT | 37 | 0.81 | 0.88 | 40 | 0.38 | 0.63 | 2.27 | 0.02 | 0.07 |
| AirdrakeBT | 37 | 0.54 | 0.65 | 40 | 0.23 | 0.53 | 2.56 | 0.01 | 0.09 |
| FiredrakeRT | 37 | 0.41 | 0.76 | 40 | 0.78 | 0.86 | 2.29 | 0.02 | 0.07 |
| WaterdrakeRT | 37 | 0.49 | 0.80 | 40 | 0.78 | 0.92 | 1.55 | 0.12 | 0.03 |
| EarthdrakeRT | 37 | 0.35 | 0.54 | 40 | 0.80 | 0.88 | 2.28 | 0.02 | 0.07 |
| AirdrakeRT | 37 | 0.24 | 0.49 | 40 | 0.73 | 0.82 | 2.93 | 0.00 | 0.11 |
| ElderdrakeBT | 37 | 0.16 | 0.37 | 40 | 0.03 | 0.16 | 2.08 | 0.04 | 0.06 |
| ElderdrakeRT | 37 | 0.03 | 0.16 | 40 | 0.20 | 0.46 | 2.12 | 0.03 | 0.06 |
| TimeHerald | 37 | 12:39 | 01:38 | 38 | 12:29 | 01:26 | 0.33 | 0.74 | 0.00 |
| TimeFirstNashor | 34 | 26:06 | 04:01 | 39 | 24:37 | 02:55 | 1.46 | 0.14 | 0.03 |
| NashorBT | 37 | 1.16 | 0.55 | 40 | 0.23 | 0.48 | 6.16 | 0.00 | 0.50 |
| NashorRT | 37 | 0.11 | 0.31 | 40 | 1.25 | 0.74 | 6.78 | 0.00 | 0.60 |
Regression analysis has been conducted on the significant variables (Figure 1). It can be observed that turrets destroyed by the red team is the essential variable. If the team who plays on the red side can eliminate 7 turrets, they will have a high possibility of obtaining victory; but if they eliminate 6 or fewer, the blue side has a high chance of winning. This variable seems to be the most important one, with the classification and regression tree model accounting for 93.5% of total variance after the cross-validation analysis (estimation 0.065 ± 0.028), with a percentage of correctly classification of 96.1%.
Figure 1 - Classification and regression tree analysis of winner side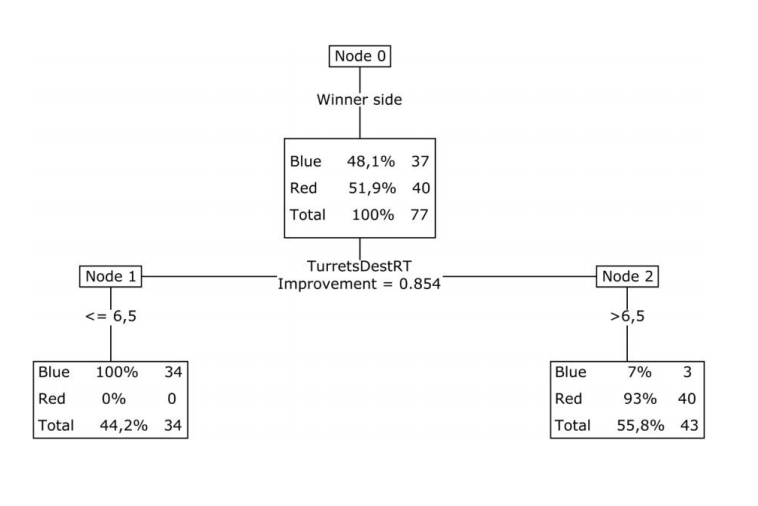
Additionally, correlation matrix between significant variables can be observed in the Table 8. The number of turrets destroyed presented a high number of correlations and an important value in correlations (ρ), in both sides.
Table 8 - Correlations between changing variables based in winner side.| Kills BTeam | Kills RTeam | Turrets DestBT | Turrets DestRT | Inhib DestBT | Inhib DestRT | GoldFinal BTK | GoldFinal RTK | Drakes Blue | Drakes Red | Nashor BT | Nashor RT | |
|---|---|---|---|---|---|---|---|---|---|---|---|---|
| KillsBTeam | 1,000 | -0,164 | ,753** | -,586** | ,747** | -,548** | ,619** | 0,045 | ,547** | -,390** | ,658** | -,471** |
| KillsRTeam | 1,000 | -,524** | ,650** | -,463** | ,664** | 0,072 | ,666** | -,417** | ,553** | -,341** | ,654** | |
| TurretsDestBT | 1,000 | -,743** | ,886** | -,716** | ,591** | -0,184 | ,681** | -,579** | ,788** | -,645** | ||
| TurretsDestRT | 1,000 | -,699** | ,897** | -,225* | ,526** | -,573** | ,641** | -,625** | ,796** | |||
| InhibDestBT | 1,000 | -,715** | ,517** | -0,186 | ,597** | -,540** | ,718** | -,632** | ||||
| InhibDestRT | 1,000 | -0,212 | ,511** | -,483** | ,574** | -,575** | ,829** | |||||
| GoldFinalBTK | 1,000 | ,612** | ,447** | -0,021 | ,593** | -0,170 | ||||||
| GoldFinalRTK | 1,000 | -0,165 | ,561** | -0,041 | ,490** | |||||||
| DrakesBlue | 1,000 | -,806** | ,680** | -,466** | ||||||||
| DrakesRed | 1,000 | -,472** | ,533** | |||||||||
| NashorBT | 1,000 | -,640** | ||||||||||
| NashorRT | 1,000 |
Discussion
The main findings of this study were (1) variables such as structures, kills, gold and main neutral objectives presented changes considering the outcome of the game (in this case, winner side) with different size effects, and (2) the number of turrets destroyed by teams who played in the red side could be a good predictor of winner side, being 6 red-side-towers the key number for establishing a prediction.
Regarding the side that wins the game, we observe that the red side achieved more victories (51,9%) than the blue side (48,1%) in high performance players. This data is contrary to the thought that the team who plays on the blue side has an advantage over their opponent due to the preference in choosing characters in each game (De Matías, 2014). Worlds 2018 presented a 54,62% of win ratio in all tournament, including the Play–In phase (Novak et al., 2019b). In 2019 Summer Split of LCS, the blue side managed at 67% win ratio and LEC also had a higher blue side rate (53%), although this data is drawn from a limited sample size (15 games and 15 games respectively; . According to database Sevenhuysen, across the 2020 World Championship Series, in 76 games the red side achieved a 53,9% win rate.
Generally, first blood was obtained by one of the teams before achieving the first objective such as a tower or the Rift Herald. Following the line of the eliminations made, both sides have even averages, only half a point difference between blue team and red team (13.19 ± 6.62 and 13.77 ± 6.95, respectively). Moreover, at the end of the game, significant differences were found in the kills made by the team according to the side that wins the game, being higher when it is victorious side. In the same way, final gold earned was higher for the side that won.
Focusing on neutral objectives, the red team collected the Rift Herald with more often (51.9%), although the first Baron Nashor kill was more often obtained by the blue team(50.6%). In comparation, Novak et al. (2019b) observed that blue team scored first Baron Nashor and Rift Herald most of the games. It is necessary to consider what happened with both Rift Herald and Baron Nashor in the studies. In Novak et al. (2019b) there were games discarded in which no elimination of these objectives was registered, or the Herald orb was not collected, even though a team was able to defeat him. Regarding the Baron Nashor, a strong association was found between the team that gets the first Baron Nashor and the team that wins the game, also achieving a higher number of kills when the same team obtains a victory.
To sum up, variables appear to stack onto each other leading to victory. It could be due to the fact of snowballing from an early game advantage, or an achievement of the main objectives throughout the game, bringing more benefits to the team which managed it, as gold, experience, or buffs. These differences can be observed in the Table 9.
Table 9 - Summary of changing variables of this study| Winner side | |||||||
|---|---|---|---|---|---|---|---|
| B (N = 37) | R (N = 40) | Size effect | |||||
| M ± SD | M ± SD | P Value | Cramer´s V | d | \(η_2\) | Interpreting | |
| KillsBTeam | 17,95 ± 4,16 | 8,8 ± 5,31 | ,000 | ,49 | Large | ||
| KillsRTeam | 9,73 ± 6,39 | 17,5 ± 5,17 | ,000 | 1,34 | Large | ||
| GoldFinalBTK | 64,51 ± 10,53 | 54,19 ± 13,17 | ,000 | ,8 | Large | ||
| GoldFinalRTK | 54,6 ± 12,77 | 64,14 ± 11,43 | ,000 | ,79 | Moderate | ||
| TurretsDestBT | 9,19 ± 1,24 | 3,10 ± 2,06 | ,000 | ,73 | Large | ||
| TurretsDestRT | 2,59 ± 2,05 | 9,98 ± 1,17 | ,000 | ,75 | Large | ||
| InhibDestBT | 1,59 ± 0,76 | 0,15 ± 0,43 | ,000 | ,68 | Large | ||
| InhibDestRT | 0,16 ± 0,44 | 1,93 ± 1,07 | ,000 | ,71 | Large | ||
| DrakesBlue | 2,73 ± 0,99 | 1,10 ± 1,15 | ,000 | ,38 | Large | ||
| FiredrakeBT | 0,76 ± 0,8 | 0,2 ± 0,41 | ,001 | ,15 | Large | ||
| DrakesRed | 1,49 ± 1,35 | 3,08 ± 0,97 | ,000 | ,38 | Large | ||
| AirdrakeRT | 0,24 ± 0,49 | 0,73 ± 0,82 | ,003 | ,11 | Medium | ||
| FirstTeamNashor | Strong | ||||||
| Blue (N) | 32 | 7 | ,000 | ,751 | |||
| Red (N) | 2 | 1 | |||||
| None (N) | 3 | 32 | |||||
| NashorBT | 1,16 ± 0,55 | 0,23 ± 0,48 | ,000 | 0,5 | Large | ||
| NashorRT | 0,11 ± 0,31 | 1,25 ± 0,74 | ,000 | 0,6 | Large | ||
In terms of structures, the inhibitors presented the same pattern as the rest of the variables that correlated with the winning side. Towers destroyed could be considered an important part of the game, according to the obtained results, especially those managed by red team. These variables could be taken as an impact element on victory achievement, being able to develop a strategy for high performance teams guided to these kinds of structures, in order to increase their chances of winning a match. The results are on the same wavelength as Wang (2018), where turrets showed significant differences depending on the winning side, being greater when their side is the one that wins the game.
The results of this study are not surprising if we bear in mind that concurring with Novak et al. (2019b), when it is considered tower difference (between enemy and own turrets destroyed) and inhibitors taken as most important variables related to match outcome. A possible reason for these findings could be the role of the towers, being the main defensive element for the nexus, as the only way to reach it is through the towers, being necessary to destroy at least 5 to be able to attack the enemy nexus.
We believe that the identification of these variables and the significant relationships with the result will be important when making decisions inside and outside the game, providing the technical staff of the professional League of Legends teams with elements to consider in the construction of a “game model” or game plan. These can be used not solely for a better knowledge of the metagame but also to create strategy guides to improve the chance to win, considering the correlations among them. Towers destroyed was highlighted as a good variable to develop a framework from.
As future lines of investigation, we propose using this data to consider key variables and build a model or a game-style, as well an analysis of differences between regional and international competitions, or to compare performance between teams. The vision score and the use of wards could be interesting for this area, as has been observed in other research (Pedrassoli Chitayat et al., 2020)
Study limitations
We must point out that League of Legends is an environment of constant change, so the modifications that are made can affect the importance of the variables, the inclusion of new variables and their relationship with the final objective. In this case, we are talking about patch 9.19, in which the tournament was played, but in the one corresponding to the following season, important alterations were carried out, such as the introduction of a second herald, and the changing requirements to achieve an elder dragon.
Finally, although it is true that studies on this topic are being developed recently, there is still a low number of studies in based upon the World Championship Series. Most research to date has focused on forecast analysis and chose regular leagues for develop main variables. These variables could be affected by possible changes, type of game (BO1, BO3 or BO5), evolutions in the game or own region style, which make difficult to specify key factors of the game and established a comparation between them.
Acknowledgments
We are grateful for the contribution by Sevenhuysen with its database to this research, and giving us permission to use it, because without this we would not be able to complete our data comparison in order to realise the statistical analysis.
Declaration of interest statement
The authors report no conflict of interest. No funding was received.
References
- Aryanata, G. A., Rahadi, P. S. A. D., & Sudarmojo, Y. P. (2017). Prediction of DOTA 2 Match Result by Using Analytical Hierarchy Process Method. International Journal of Engineering and Emerging Technology, 2(1), 22. https://doi.org/10.24843/ijeet.2017.v02.i01.p05
- Aung, M., Bonometti, V., Drachen, A., Cowling, P., Kokkinakis, A. V., Yoder, C., & Wade, A. (2018). Predicting skill learning in a large, longitudinal MOBA dataset. IEEE Conference on Computatonal Intelligence and Games (CIG), 1–7. https://doi.org/10.1109/CIG.2018.8490431
- Bornemark, O. (2013). Success factors for e-sport games. USCCS 2013, 1.
- Cohen, J. (1988). Statistical power analysis of the behavioral sciences. (2nd ed.). New York: Academic Press
- De Matías, J. E. (2014). E-Sports y LoL como práctica deportiva (Primera edición).
- Gaina, R., & Nordmoen, C. (2018). League of Legends: A Study of Early Game Impact.
- Hamari, J., & Sjöblom, M. (2017). What is eSports and why do people watch it? Internet Research, 27(2), 211–232. https://doi.org/10.1108/IntR-04-2016-0085
- Hinkle, D. E., Wiersma, W., & Jurs, S. G. (1979). Applied statistics for the behavioral sciences.
- Hodge, V., Devlin, S., Sephton, N., Block, F., Cowling, P., & Drachen, A. (2019). Win Prediction in Multi-Player Esports: Live Professional Match Prediction. IEEE Transactions on Games, PP, 1–1. https://doi.org/10.1109/tg.2019.2948469
- Hodge, V., Devlin, S., Sephton, N., Block, F., Drachen, A., & Cowling, P. (2017). Win prediction in esports: Mixed-rank match prediction in multi-player online battle arena games. ArXiv, 2015.
- Morse, D. . (1999). Minsize2: a computer program for determining effect size and minimum sample size for statistical significance for univariate, multivariate, and nonparametric tests. Journals.Sagepub.Com, 59(3), 518–531. https://doi.org/10.1177/00131649921969901
- Newzoo (2017). Global Games Market Report: An overview of trends and insights. Retrieved April, 9, 2018
- Newzoo (2020). Global Esports Market Report [Internet]. Amsterdam; 2020.
- Novak, A. R., Bennett, K. J. M., Pluss, M. A., & Fransen, J. (2019a). Performance analysis in esports: part 1 - the validity and reliability of match statistics and notational analysis in League of Legends. SportRxiv, October. https://doi.org/10.31236/osf.io/sm3nj
- Novak, A. R., Bennett, K. J. M., Pluss, M. A., & Fransen, J. (2019b). Performance analysis in esports: part 2 – modelling performance at the 2018 League of Legends World Championship. SportRxiv, October. https://doi.org/10.31236/osf.io/84fmy
- Ong, H. Y., Deolalikar, S., & Peng, M. (2015). Player Behavior and Optimal Team Composition for Online Multiplayer Games. http://arxiv.org/abs/1503.02230
- Pedrassoli Chitayat, A., Kokkinakis, A., Patra, S., Demediuk, S., Robertson, J., Olarewaju, O., Ursu, M., Kirmann, B., Hook, J., Block, F., & Drachen, A. (2020). WARDS: Modelling the Worth of Vision in MOBA’s. In K. Arai, S. Kapoor, & R. Bhatia (Eds.), Intelligent Computing. Proceedings of the 2020 Computing Conference (Vol. 2, pp. 63–81). Springer International Publishing. https://doi.org/10.1007/978-3-030-52246-9_5
- Rea, L. M., & Parker, R. A. (1992). Designing and conducting survey research. San Francisco, CA: Jossey– Bass
- Reitman, J. G., Anderson-Coto, M. J., Wu, M., Lee, J. S., & Steinkuehler, C. (2020). Esports research: a literature review. Games and Culture, 1–19. https://doi.org/10.1177/1555412019840892
- Salen Tekinbas, K., & Zimmerman, E. (2003). Rules of play: game desing fundamentals (The MIT Press).
- Sevenhuysen, T. (2020). Oracle’s elixir: League of Legends eSports statistics. Retrieved June 3, 2020, from https://oracleselixir.com/matchdata/
- Todeschini de Souza, R., & Nogueira Cortimiglia, M. (2017). Aplicação de algoritmos classificadores para previsão de vitória em uma partida de League of Legends (pp. 1–21).
- Wagner, M. G. (2006). On the Scientific Relevance of eSports. Proceedings of the 2006 International Conference on Internet Computing and Conference on Computer Game Development, 4.
- Wang, T. (2018). Predictive Analysis on eSports Games – A Case Study on League of Legends (LoL) eSports Tournaments.
- Yang, Y., Qin, T., & Lei, Y. H. (2016). Real-time eSports Match Result Prediction. ArXiv, Nips, 1– 9.
- Yang, Z., Pan, Z., Wang, Y., Cai, D., Shi, S., Huang, S., & Liu, X. (2020a). Interpretable RealTime Win Prediction for Honor of Kings, a Popular Mobile MOBA Esport. ArXiv, 1–8. http://arxiv.org/abs/2008.06313
- Yang, Z., Wang, Y., Li, P., Lin, S., Shi, S., & Huang, S. (2020b). Predicting events in MOBA games: Dataset, attribution, and evaluation. ArXiv, 1–8.
- Yue, Y., Rui, W., Chiang, S., & Ling, S. (2020). An insight into the esports industry in China. International Journal of Esports, 1(1).
1 The patch is the update in which the game is developed, making changes periodically in terms of the selectable characters, items, solve possible weakness or strengths within the game.