A Comparison of Self-reported Level of Physical Activity of Collegiate Esports Players with that of Non-esports Undergraduate Students
by Nicholas Latuszek*, Mitchell Anderson, Brady Griffith, Jan PerkinsEmail: Nick.Latuszek@gmail.com
Received: 31 Dec 2023 / Published: 08 Mar 2026
Abstract
ABSTRACT
Aims
The electronic sports (esports) industry has gained tremendous popularity throughout the past several decades. With this growth, competitive esports leagues have emerged at the collegiate level. However, few studies have been conducted that examine physical activity (PA) levels in the collegiate esports population. This study compares the levels of PA and total time sitting of collegiate esports players and non-esports undergraduate students.
Methods and results
Twelve collegiate esports players and 39 non-esports undergraduate students from the same higher education institution participated in the study. Each group completed a survey consisting of basic demographics, esports participation, and the International Physical Activity Questionnaire (IPAQ). Results revealed that collegiate esports players reported participation in similar levels of PA as non-esports undergraduate students. However, esports players spent significantly more time sitting than other undergraduates.
Conclusion
The present study concluded that collegiate esports players do not differ from non-playing peers in their self-reported levels of PA but do report significantly more time spent in sitting. It is possible that participation in collegiate level esports competitions might have influenced these behaviors. We encourage further investigation.
Introduction
Physical inactivity, sedentary lifestyles, and poor diets are major risk factors for premature death.1 Research suggests that participation in esports may be linked to many of those risk factors, as well as increased stress levels and sleep disturbances, which has led to a debate as to whether esports should be classified as a sport. 1 We lack information on esports players and their lifestyle as compared to the general population, thus suggesting further research to clarify levels of activity and to assist in developing physical activity guidelines for these athletes. 1 Our study compared physical activity (PA) levels and total time spent sitting of collegiate esports athletes and other undergraduate college students utilizing the International Physical Activity Questionnaire (IPAQ) to develop baseline information.
Esports can be defined as any variation of competitive gaming mediated through human-computer interfaces. Participants use computers or specific video game consoles to compete individually or in teams.2 Since the start of the COVID-19 pandemic, both the number of individuals playing video games and the amount of time spent playing by experienced gamers have significantly increased.3 In 2021, there were 3.24 billion video gamers in the world,4 including 97% of 12-17 year-olds.5 This growth in popularity may be due to the easy accessibility of internet-based video games, vs other sports or game participation. This staggering number of video game participants has attracted business interest with advertising contributing $250 million-dollars to esports in 2017.6
As the popularity of gaming increased over the last several years, over 8,600 high schools in North America have founded esports varsity teams. 7 It is anticipated that growth will continue in the near future, with likely expansion at collegiate and professional levels. As of 2021, video games currently are a $188.7 billion-dollar global market, with a predicted 2029 market value upwards of $307.19 billion-dollars.8 Esports specifically produced $1.22 billion-dollars in 2021 and has a 2029 predicted value of $5.48 billion-dollars.9 This amount of money has led to the creation of several esports platforms such as Twitch.com™,10 and encouraged the introduction of esports at the collegiate level. There are 175 universities participating in NACE (National Association of Collegiate Esports),7 making 15 million dollars in scholarships available to students.11 With the growing popularity of esports, it becomes vital to understand lifestyle changes, including alterations in PA, and how they affect health risks or benefits associated with esports participation.
Esports athletes struggle with obtaining the proper nutrition, beneficial sleep, and regular exercise due to poor lifestyle habits.12 In the limited research available, one study found that just under 40% of their esports participants stated they had no PA outside of esports participation, and 15% reported ≥ 3 hours of uninterrupted sitting daily.13 Though these numbers seem eye-opening, the PA for the average undergraduate students is also low. The reported average daily sedentary time for an undergraduate student was found to be 11.10 - 1.88 hours.14-15 This study compares PA levels and total time sitting between collegiate esports players and non-esports undergraduate students. It was hypothesized that the esports players would demonstrate both greater levels of PA and total time sitting when compared to non-esports undergraduate students. Understanding how active esports players are will help in designing activity recommendations to promote health for gamers and improve their profile as a sport.
Aim: The aim of this study was to compare PA levels between collegiate esports athletes and undergraduate students at a public university in the American Midwest using the IPAQ.
Methods
Participants
Fourteen collegiate esports players (n=14) and 46 non-esports undergraduate students (n=46) were recruited to participate in the study. Two collegiate esports players (n=2) and 7 non-esports undergraduate students (n=7) failed to complete the survey, leaving twelve collegiate esports players (one female, 11 males, n=12), and 39 non-esports undergraduate students (n=39), consisting of 31 females, 6 males, and 2 non-binary or prefer not to share, all undergraduates at the university participated. In total, fifty-one participants (n =51) between 19 and 26 years old participated from a public university in the American Midwest. Inclusion criteria for the esports group were being at least 18 years old and being a member of a varsity or club esports team. The comparison group were undergraduate students enrolled in a healthy lifestyle course at the same university, where each met the university's definition of full-time students. Pregnancy was an exclusion criterion. Incomplete surveys were excluded from the data analysis. Following informed consent, participants completed the demographic survey section and the IPAQ. Compensation was awarded to all participants for the completion of the survey. Participants selected a $10 gift card to Amazon.com™ or 15 points of extra credit for the healthy lifestyle course.
Research Design
The study utilized a survey to collect anonymous data from a sample of collegiate esports players and non- The study utilized a survey to collect anonymous data from a sample of collegiate esports players and non-esports undergraduate students. The survey was delivered electronically using Qualtrics (Qualtrics 2022 © Provo, UT). Qualtrics was used as an efficient means of delivering the survey to this population, versus a paper survey.16
The survey was considered a ‘low-risk’ intervention; however, participants might not be comfortable with revealing such personal information which led to data being collected and analyzed anonymously. Surveys also did not include other personal identifiers such as date of birth. Names and contact information were used solely for distributing compensation and data files were de-identified after compensation was given.
Data Collection and Analysis
The survey consisted of an informed consent form, the survey for each group (consisting of the participant’s demographics (age, gender, class standing, major of study, specific group questions), the IPAQ, and a debriefing form. Table 1 includes the demographic section for the collegiate esports players, and Table 2 the demographic section for the non-esports undergraduate students. Table A (Supplementary Material) contains the IPAQ that was given to both groups. Once the participant completed the survey, they received a random participant code and were redirected to Microsoft Forms (Microsoft 2022© Redmond, WA) to collect the participant’s information for the purpose of compensation. The purpose of the participant code at the end of the survey was to ensure that individuals who received compensation had participated in the study. We did not re-identify the subject through this participant code. Once the participant code was verified, it was deleted.
Table 1. Demographics – Collegiate Esports Players*Table one placed here please check if your happy with it and the layout| Demographics | Description | Number | Percentage | ||
|---|---|---|---|---|---|
| Gender | Female | 1 | 8 | ||
| Male | 11 | 92 | |||
| Total | 12 | 100 | |||
| Age (Years) | 19 | 1 | 8 | ||
| 20 | 4 | 33 | |||
| 21 | 2 | 17 | |||
| 22 | 3 | 25 | |||
| 23 | 2 | 17 | |||
| Total | 12 | 100 | |||
| Major | Broadcasting | 1 | 8 | ||
| Computer Science | 3 | 25 | |||
| Information Technology | 1 | 8 | |||
| Music Education | 2 | 17 | |||
| Secondary Education | 1 | 8 | |||
| Psychology | 2 | 17 | |||
| Mathematics | 2 | 17 | |||
| Total | 12 | 100 | |||
| Class Standing | Sophomore | 2 | 17 | ||
| Junior | 2 | 17 | |||
| Senior | 8 | 67 | |||
| Total | 12 | 100 | |||
| Skill Level | Varsity | 12 | 100 | ||
| Total | 12 | 100 | |||
| Primary E-sports Team | Fortnite | 2 | 17 | ||
| League of Legends | 2 | 17 | |||
| Overwatch | 3 | 25 | |||
| Rainbow Six Siege | 2 | 17 | |||
| Super Smash Bros | 1 | 8 | |||
| Valorant | 2 | 17 | |||
| Total | 12 | 100 | |||
| Duration on the Esports Team (Years) | 1 | 6 | 50 | ||
| 2 | 2 | 17 | |||
| 3 | 3 | 25 | |||
| 4 | 1 | 8 | |||
| Total | 12 | 100 |
| Time Playing Video Games Per Week (Hours) | 5 - 6 | 1 | 8 |
|---|---|---|---|
| 8 | 11 | 92 | |
| Total | 12 | 100 |
Apart from the demographic section, surveys were identical for each group, with the IPAQ being the second section. The IPAQ is a validated survey of self-reported levels of PA covering frequency and duration of exercise, walking, and sedentary behavior over the previous seven days. Earlier research has reported the IPAQ to have good validity and reliability with coefficients determined to be good at r = 0.15 - 0.26 and r = 0.71 - 0.89, respectively.17 This survey was chosen because of its established record in published literature. It is also relatively brief which encourages completion. Together our two surveys had a total of 35 questions – eight questions within the demographic section and 27 questions within the IPAQ.
Table 2. Demographics – Undergraduate Students *table 2 placed here please check placement and layout you are happy with| Demographics | Description | Number | Percentage | |
|---|---|---|---|---|
| Gender | Female | 31 | 79 | |
| Male | 6 | 15 | ||
| Non-Binary | 1 | 3 | ||
| Prefer Not to Say | 1 | 3 | ||
| Total | 39 | 100 | ||
| Age (Years) | 19 | 5 | 13 | |
| 20 | 6 | 15 | ||
| 21 | 17 | 44 | ||
| 22 | 6 | 15 | ||
| 23 | 2 | 5 | ||
| 24 | 1 | 3 | ||
| 25 | 1 | 3 | ||
| 26 | 1 | 3 | ||
| Total | 39 | 100 | ||
| Major | Advertising | 2 | 5 | |
| Animation | 2 | 5 | ||
| Athletic Training | 2 | 5 | ||
| Biology | 1 | 3 | ||
| Bio-Medical | 1 | 3 | ||
| Communication | 3 | 8 | ||
| Criminal Justice | 1 | 3 | ||
| Dietetics | 1 | 3 | ||
| Early Childhood Development | 3 | 8 | ||
| Education | 2 | 5 | ||
| Environmental science | 1 | 3 | ||
| Exercise Science | 5 | 13 | ||
| Fine Arts | 1 | 3 | ||
| Health Administration | 2 | 5 | ||
| History | 2 | 5 | ||
| Human Resources | 1 | 3 | ||
| Interior Design | 1 | 3 | ||
| Marketing | 1 | 3 | ||
| Mathematics | 1 | 3 | ||
| Nursing | 1 | 3 | ||
| Psychology | 1 | 3 | ||
| Public Health | 1 | 3 | ||
| Social Work | 1 | 3 | ||
| Sociology | 1 | 3 | ||
| Undecided | 1 | 3 | ||
| Total | 39 | 100 | ||
| Class Standing | Freshmen | 2 | 5 | |
| Sophomore | 9 | 23 | ||
| Junior | 12 | 31 | ||
| Senior | 16 | 41 | ||
| Total | 39 | 100 | ||
| Played Video Games | Yes | 19 | 49 | |
| No | 20 | 51 | ||
| Total | 39 | 100 | ||
| Time Playing Video Games Per Week (Hours) | 0 | 20 | 51 | |
| 1 - 2 | 6 | 15 | ||
| 3 - 4 | 7 | 18 | ||
| 5 - 6 | 4 | 10 | ||
| 7 - 8 | 2 | 5 | ||
| Total | 39 | 100 | ||
| Played on a Esports Team | No | 39 | 100 | |
| Total | 39 | 100 |
Statistical Analysis
Data were analyzed using IBM SPSS Statistics (Version 26). The Shapiro-Wilk test was used to check for the normal distribution of responses. While the collegiate esports group data was normally distributed, (p > .05), the undergraduate control group was not (p < .05). Despite utilizing a Box-Cox transformation to normalize the data, the optimal lambda exceeded 0.05. As the undergraduate group’s total time sitting could not be normalized from the Box-Cox transformation, an Independent-Samples Mann-Whitney U test was performed to compare total PA and total time sitting between the two groups.
Results
This study observed two groups: collegiate esports players and non-esports undergraduate students. Both groups were provided with a survey that contained the IPAQ and different demographic sections. This study analyzed IPAQ data for total PA and time spent sitting. A continuous score protocol was used to calculate the participant’s IPAQ score.18 For each answered question, the participant’s hours and minutes were converted to the metabolic equivalent of task (MET). Total PA was calculated from the sum of total work, total active transport, total domestic and garden, and total leisure time and presented in Table 3 below
Table 3. Mean Physical Activity in Each Type of the International Physical Activity Questionnaire (IPAQ) Between Collegiate Esports Players and Undergraduates. *please check location of table 3 and layout if your happy with it
Collegiate Esports
Physical activity measure
Undergraduate Players
IPAQ by type (MET min/week)
M (SD)
M (SD) Work
1814 (2477) 1968 (3607)
Transport
792 (881) 1279 (1494)
Motor Sitting
182 (179) 330 (439)
Domestic and Garden
845 (1100) 915 (1566)
Leisure
1824 (2373) 960 (1393)
Sitting
3535 (915) 2598 (1129)
Walking
1734 (1509) 2269 (2367)
Moderate Physical Activity
1422 (2032) 1501 (2263)
Vigorous Physical Activity
2119 (2190) 1350 (2356)
Total Physical Activity
5275 (4287) 5120 (6234)
Total Sitting and Motor Sitting
3717* (927) 2929 (1111)
* Total time sitting was significant with the esports player sitting longer, p = 0.015. Note: Total Physical Activity and Total Sitting and Motor Sitting underwent statistical analysis for this study.
Total sitting time was calculated from the sum of time in a motor vehicle, as well as total time sitting on a weekday and weekend.
Figure 3. Mean of total time sitting, measured in metabolic equivalent of task (MET), in seven days in collegiate esports players and undergraduate students. Total time sitting was significant with the esports players, p = 0.015. Note: Total Physical Activity and Total Sitting and Motor Sitting underwent statistical analysis for this study. Note: One MET is the amount of energy the human body utilizes while sitting.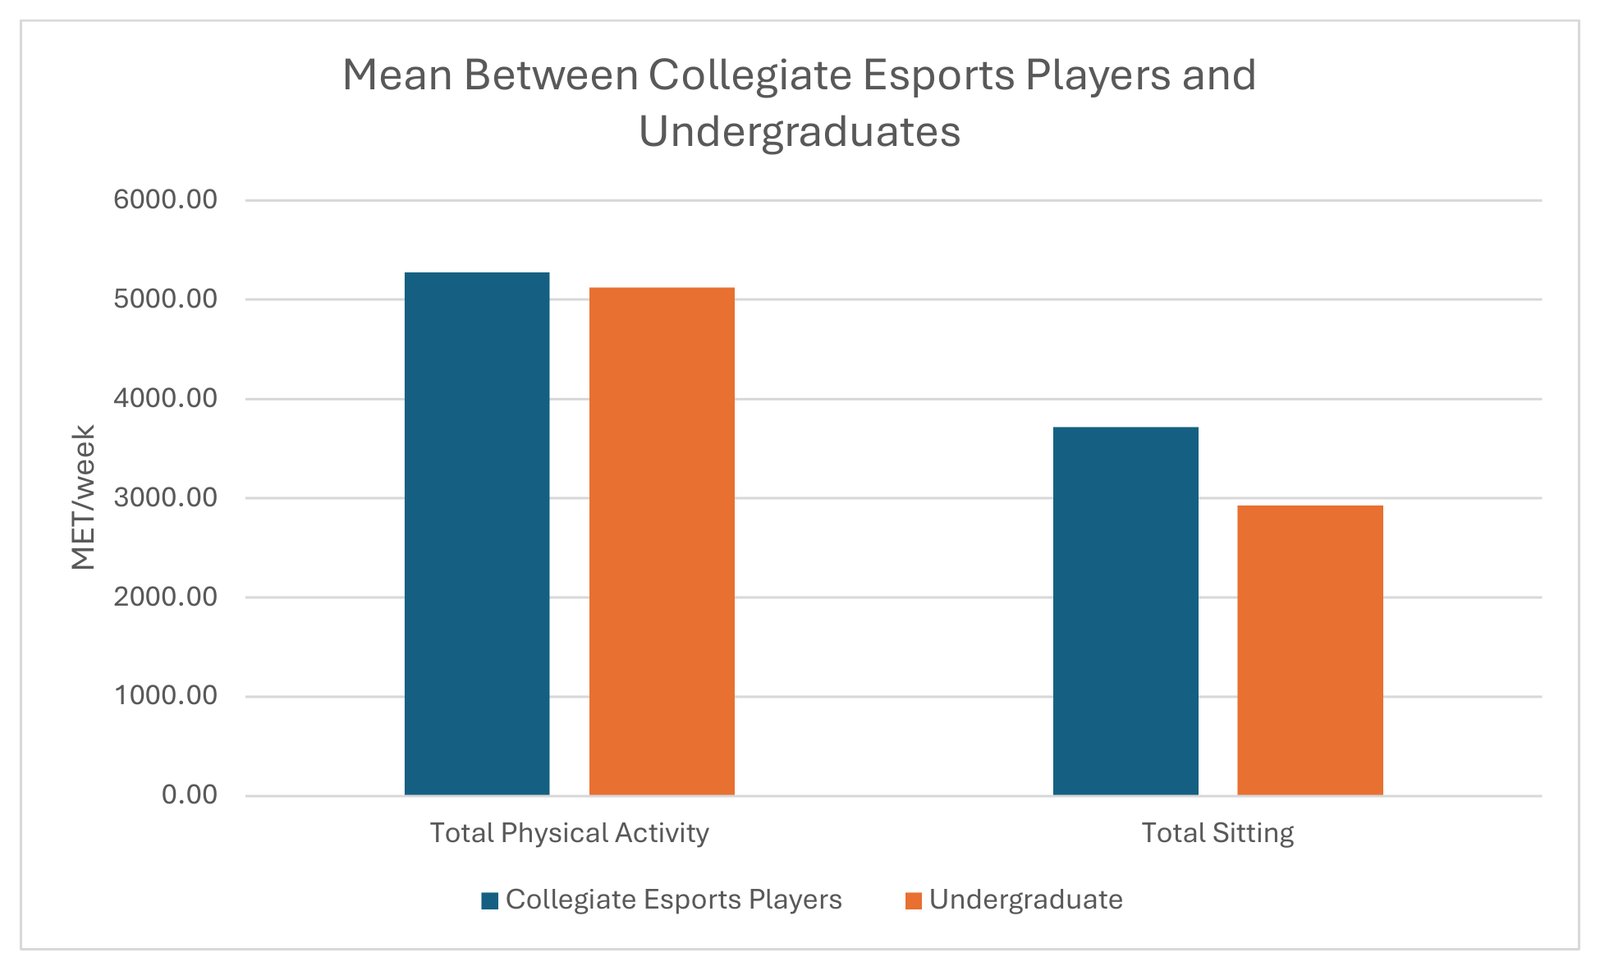 Figure 1 illustrates the frequency of total PA in each group. Median total PA from the IPAQ was compared between the two groups using the Independent-Samples Mann-Whitney U Test. There was no significant difference in median total PA between the esports players and the control group of non-esports undergraduate students, p = 0.594.
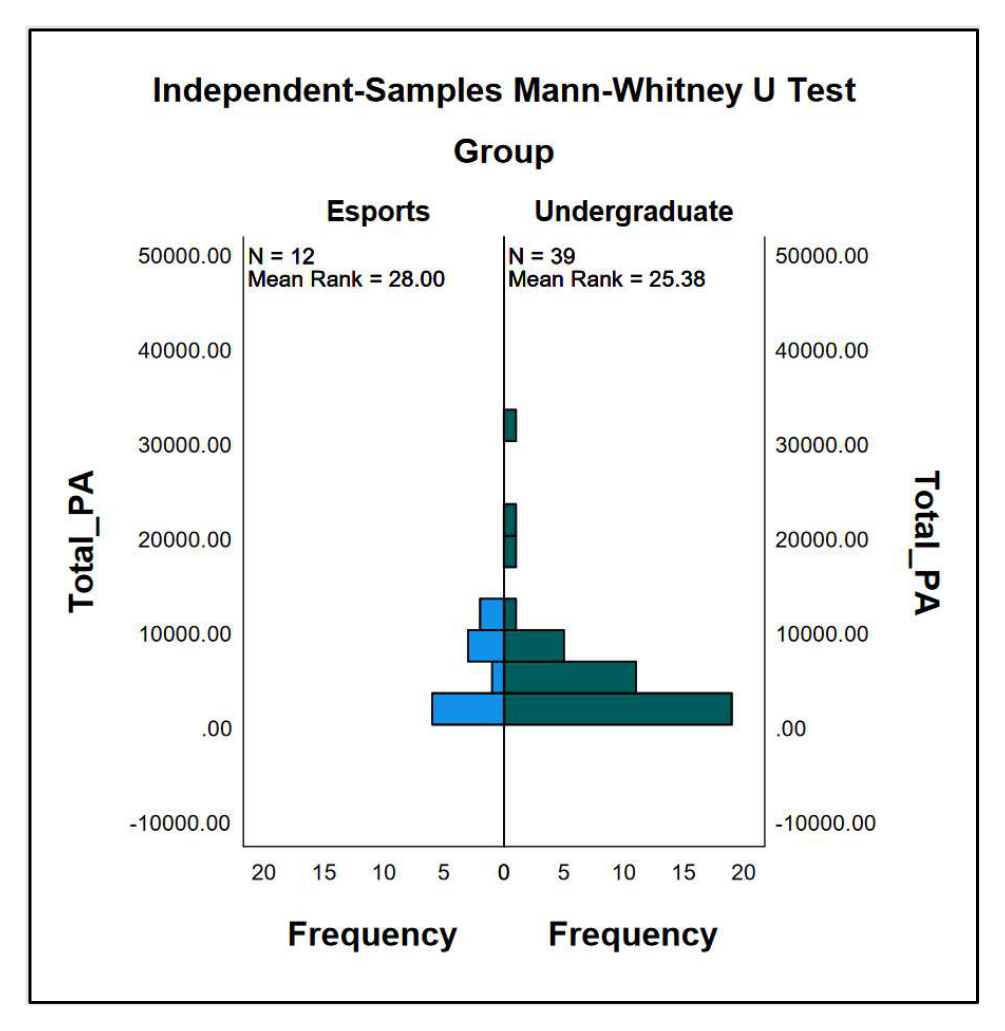
Figure 1. Frequency of total physical activity in seven days in collegiate esports players and undergraduate students. There was no difference in total physical activity between these groups, p = 0.594.
Figure 2 illustrates the frequency of total time spent sitting in each group. Median data compares the total time spent sitting in both groups. The median total time sitting showed a significant difference between the esports players and the undergraduate students, p = 0.015.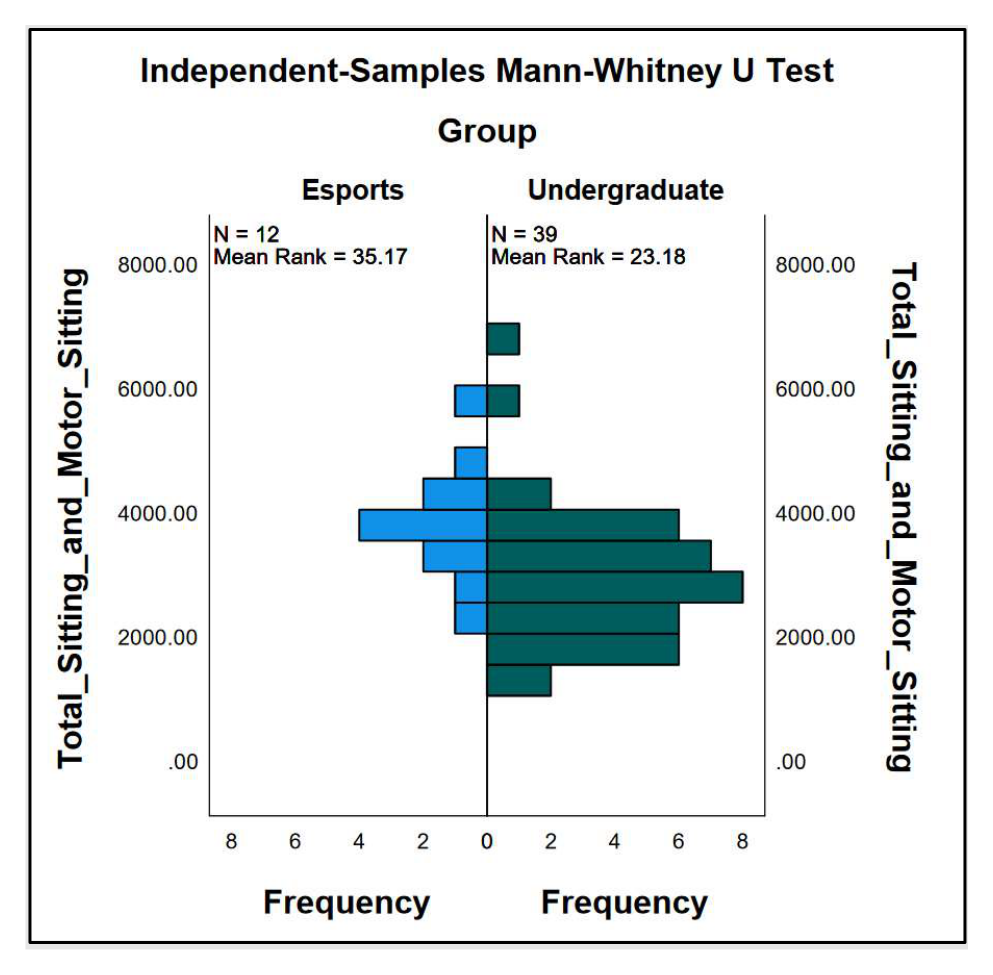
Figure 2. Frequency of total time sitting in seven days in collegiate esports players and undergraduate students. Total time sitting was significant with the esports player sitting longer, p = 0.015.
Discussion
This study was performed to compare the total PA and total time spent sitting between collegiate esports players and non-esports playing undergraduate students. It was hypothesized that esports players would demonstrate both greater levels of PA and total time sitting when compared to non-esports undergraduate students. The results partly supported our hypothesis showing that esports athletes spend more time sitting than students who were not esports players. While both groups were university students, which entails considerable time sitting dedicated to their studies, such as attending lectures and completing class-related projects and assignments, the greater total time sitting per week in esports players was hypothesized as this group required additional sitting time for gaming activities, including practice, film study, and competition. However, this study determined the self-reported PA levels between the groups were not significantly different.
Higher-performing esports players were more physically active than lower-performing esports players.19 Performance might vary between the collegiate esports players but was not observed within this study. Therefore, the results of our study further contribute to Trotter, Coulter, Davis, et al19 finding that esports players might benefit from increased PA levels. Additionally, self-proclaimed elite esports players reported exercise levels greater than the PA recommendation from the World Health Organization (WHO),20 which supports a goal of at least 150 minutes of moderate aerobic activity per week.21 The present study results are consistent with their findings as 10 out of 12 esports players and 33 out of 39 undergraduate students reported >500 MET per week. This activity level meets recommendations from the United States Department of Health and Human Services 22 (USDHHS) and the WHO. This demonstrates that the findings from this study are similar to Kari and Karhulahti’s 20 findings that esports athletes achieve the PA recommendations of the WHO and USDHHS.
This study did not find that collegiate esports players were more physically active than non-esports undergraduate students but that collegiate esports players did report significantly higher time spent in sedentary behaviors. However, most study participants in both study groups reported achieving the weekly PA recommendations of the WHO and USDHHS. The increased sedentary behavior of collegiate esports players might have been due to the time spent in esports-related activities, such as practice, film study, and competitions. Both groups reported considerable time in sitting as both contained students who must sit through classes, but the nature of this sport likely led to the esports players having elevated levels of sitting. Being a student usually requires considerable time in sitting and the nature of esports may be responsible for the group differences.
Replication of this study is suggested using a larger sample size and including other universities or colleges throughout the United States. With a larger sample size and a range of higher education institutions, data would provide greater generalizability of findings to the broader collegiate esports population. Further studies could also examine potential differences of IPAQ types between collegiate esports and undergraduate students beyond total physical activity and total sitting and motor sitting as well as examine other lifestyle factors such as diet, medication, and tobacco use of collegiate esports players. Research could also examine how these factors influence their in-game performance. Such studies could both increase our knowledge of the lifestyle behaviors of the collegiate esports population; which could be used to develop and establish health guidelines and interventions for this population.
Limitations
The sample size was small, partly because of the limited number of esports players at the selected institution. The use of only one university reduces the power of generalizability to the collegiate esports population in general. It is also difficult to determine whether the self-reported nature of the data may have affected results. A future study might want to include validation measures for the IPAQ with this group.
Conclusion
Limited studies have examined the level of PA in collegiate esports players making it difficult to develop evidence-based health programs and guidelines for this population. This study found that collegiate esports players were not more or less physically active than non-esports undergraduate students but found that collegiate esports players did report significantly higher time spent in sedentary behaviors. Despite a small sample size, further investigation into PA levels is warranted to address health risks in collegiate esports players, such as investigation into PA levels between collegiate esports players and traditional sport athletes or non-physical sport athletes, such as chess or billiards.
Acknowledgments
The authors would like to acknowledge and thank Dr. Chin-I Cheng, Ph.D. for her assistance with statistical analysis.
Funding
Herbert H. and Grace A. Dow College of Health Professions at Central Michigan University, for author NCL.
Declaration of Interest
The authors confirm that there are no conflicts of interest to declare.
References
- Ketelhut S, Martin-Niedecken AL, Zimmermann P, Nigg CR. Physical activity and health promotion in esports and gaming-discussing unique opportunities for an unprecedented cultural phenomenon. Front Sports Act Living. 2021;3:693700. Published 2021 Sep 16. doi:10.3389/fspor.2021.693700
- What are esports?. Discover Esports website. https://discoveresports.com/what-are-esports/. Accessed November 16, 2022.
- Barr M, Copeland-Stewart A. Playing video games during the COVID-19 pandemic and effects on players’ well being. Games Cult. 2021;17(1): 122-139. https://doi.org/10.1177/15554120211017036
- Clement J. Number of gamers worldwide. Statista website. Published January 29, 2021. https://www.statista.com/statistics/293304/number-video-gamers/#:~:text=In%20total%2C%20there%20were%20an
- Teens, video games and civics. Pew Research Center website. Published September 16, 2008. https://www.pewresearch.org/internet/2008/09/16/teens-video-games-and-civics/. Accessed November 16, 2022.
- College varsity esports programs on the rise: how gaming is changing college for gamers. Game Designing website. Published November 1, 2022. https://www.gamedesigning.org/schools/varsity-esports/. Accessed November 16, 2022.
- The rise of Esports in academic institutions in the US. InvenGlobal website. Published June 26, 2022. https://www.invenglobal.com/articles/17550/the-rise-of-esports-in-academic-institutions-in-the-us#:~:text=Esports%20in%20High%20School&text=According%20to%20the%20National%20Educat ion. Accessed February 15, 2023.
- Video games market size, share & covid-19 impact analysis, by device (smartphones, PC/laptop, and consoles), by age group (generation X, generation Y, and generation Z), by platform type (online and offline), and regional forecast, 2022-2029. Fortune Business Insight website. Published February 2023. https://www.fortunebusinessinsights.com/video-game-market-102548. Published February 2023. Accessed March 14, 2023.
- Esports market size, share & covid-19 impact analysis, by streaming type (live and on-demand), by revenue streaming (media rights, advertisement, sponsorship, ticket & merchandise, game publisher fees, and others), by gaming genre (real-time strategy games, first person shooter games, fighting games, multiplayer online battle arena games, mass multiplayer online role-playing games, and others), and regional forecast, 2022-2029. Fortune Business Insight website. Published September 2022. https://www.fortunebusinessinsights.com/esports-market-106820. Accessed March 14, 2023.
- Streaming platforms. Esports Charts website. https://escharts.com/platforms. Accessed November 19, 2022.
- Collegiate Esports: much more than a game. Global Sport Matters website. Published September 24, 2020. https://globalsportmatters.com/business/2020/09/24/collegiate-esports-much-more-than-a-game/. Accessed February 20, 2023.
- Baumann A, Mentzoni RA, Erevik E, Pallesen S. A qualitative study on Norwegian esports students’ sleep, nutritional and physical activity habits and the link to health and performance. International Journal of Esports. 2022;2(2). https://www.ijesports.org/article/88/html
- DiFrancisco-Donoghue J, Balentine J, Schmidt G, Zwibel H. Managing the health of the eSport athlete: an integrated health management model. BMJ Open Sport Exerc Med. 2019;5(1):e000467. doi:10.1136/bmjsem-2018-000467
- Moulin MS, Truelove S, Burke SM, Irwin JD. Sedentary time among undergraduate students: A systematic review. J. Am. Coll. Health Published online September 13, 2019:1-8. doi:10.1080/07448481.2019.1661422
- Moulin MS, Irwin JD. An assessment of sedentary time among undergraduate students at a Canadian university. International Journal of Exercise Science website. Published in 2017. https://digitalcommons.wku.edu/ijes/vol10/iss8/3/. Accessed November 29, 2022.
- Carpenter TP, Pogacar R, Pullig C, et al. Survey-software implicit association tests: a methodological and empirical analysis. Behav Res. 2019;51:2194–2208. https://doi.org/10.3758/s13428-019-01293-3
- Dinger MK, Behrens TK, Han JL. Validity and reliability of the international physical activity questionnaire in college students. Am. J. Health Educ. 2013;37(6):337-343. Doi: 10.1080/19325037.2006.10598924
- International Physical Questionnaire. Guidelines for data processing and analysis of the international physical activity questionnaire – short and long forms. International Physical Questionnaire; 2005. https://sites.google.com/site/theipaq/scoring-protocol. Accessed November 20, 2022.
- Trotter MG, Coulter TJ, Davis PA, Poulus DR, Polman R. The association between esports participation, health and physical activity behaviour. Int. J. Environ. Res. Public Health. 2020; 17(19):7329. https://doi.org/10.3390/ijerph17197329. Accessed August 30, 2021.
- Kari T, Karhulahti VM. Do e-athletes move?: a study on training and physical exercise in elite e-sports. IJGCMS. 2016;8(4):53-66. Doi: 10.4018/IJGCMS.2016100104
- World Health Organization. Physical activity. Published October 5, 2022. https://www.who.int/news-room/fact-sheets/detail/physical-activity. Accessed November 20, 2022.
- U.S. Department of Health and Human Services. Physical activity guidelines for Americans 2nd edition. U.S. Department of Health and Human Services; 2018. https://health.gov/sites/default/files/2019-09/Physical_Activity_Guidelines_2nd_edition.pdf. Accessed November 29, 2022.
- International Physical Questionnaire. Downloadable questionnaires. International Physical Questionnaire; 2005. https://sites.google.com/site/theipaq/questionnaire_links. Accessed February 5, 2023. Supplementary Material Table A. International Physical Activity Questionnaire (IPAQ) 23 International Physical Activity Questionnaire (IPAQ) 23 INTERNATIONAL PHYSICAL ACTIVITY QUESTIONNAIRE (October 2002) LONG LAST 7 DAYS SELF-ADMINISTERED FORMAT FOR USE WITH YOUNG AND MIDDLE-AGED ADULTS (15-69 years) The International Physical Activity Questionnaires (IPAQ) comprises a set of 4 questionnaires. Long (5 activity domains asked independently) and short (4 generic items) versions for use by either telephone or self-administered methods are available. The purpose of the questionnaires is to provide common instruments that can be used to obtain internationally comparable data on health–related physical activity. Background on IPAQ The development of an international measure for physical activity commenced in Geneva in 1998 and was followed by extensive reliability and validity testing undertaken across 12 countries (14 sites) during 2000. The final results suggest that these measures have acceptable measurement properties for use in many settings and in different languages, and are suitable for national population-based prevalence studies of participation in physical activity. Using IPAQ Use of the IPAQ instruments for monitoring and research purposes is encouraged. It is recommended that no changes be made to the order or wording of the questions as this will affect the psychometric properties of the instruments. Translation from English and Cultural Adaptation Translation from English is encouraged to facilitate worldwide use of IPAQ. Information on the availability of IPAQ in different languages can be obtained at www.ipaq.ki.se. If a new translation is undertaken we highly recommend using the prescribed back translation methods available on the IPAQ website. If possible please consider making your translated version of IPAQ available to others by contributing it to the IPAQ website. Further details on translation and cultural adaptation can be downloaded from the website. Further Developments of IPAQ International collaboration on IPAQ is on-going and an International Physical Activity Prevalence Study is in progress. For further information see the IPAQ website. More Information More detailed information on the IPAQ process and the research methods used in the development of IPAQ instruments is available at www.ipaq.ki.se and Booth, M.L. (2000). Assessment of Physical Activity: An International Perspective. Research Quarterly for Exercise and Sport, 71 (2): s114-20. Other scientific publications and presentations on the use of IPAQ are summarized on the website. INTERNATIONAL PHYSICAL ACTIVITY QUESTIONNAIRE We are interested in finding out about the kinds of physical activities that people do as part of their everyday lives. The questions will ask you about the time you spent being physically active in the last 7 days. Please answer each question even if you do not consider yourself to be an active person. Please think about the activities you do at work, as part of your house and yard work, to get from place to place, and in your spare time for recreation, exercise or sport. Think about all the vigorous and moderate activities that you did in the last 7 days. Vigorous physical activities refer to activities that take hard physical effort and make you breathe much harder than normal. Moderate activities refer to activities that take moderate physical effort and make you breathe somewhat harder than normal. PART 1: JOB-RELATED PHYSICAL ACTIVITY The first section is about your work. This includes paid jobs, farming, volunteer work, course work, and any other unpaid work that you did outside your home. Do not include unpaid work you might do around your home, like housework, yard work, general maintenance, and caring for your family. These are asked in Part 3. 1. Do you currently have a job or do any unpaid work outside your home? Yes No Skip to PART 2: TRANSPORTATION The next questions are about all the physical activity you did in the last 7 days as part of your paid or unpaid work. This does not include traveling to and from work. 2. During the last 7 days, on how many days did you do vigorous physical activities like heavy lifting, digging, heavy construction, or climbing up stairs as part of your work? Think about only those physical activities that you did for at least 10 minutes at a time. _____ days per week No vigorous job-related physical activity Skip to question 4 3. How much time did you usually spend on one of those days doing vigorous physical activities as part of your work? _____ hours per day _____ minutes per day 4. Again, think about only those physical activities that you did for at least 10 minutes at a time. During the last 7 days, on how many days did you do moderate physical activities like carrying light loads as part of your work? Please do not include walking. _____ days per week No moderate job-related physical activity Skip to question 6 5. How much time did you usually spend on one of those days doing moderate physical activities as part of your work? _____ hours per day _____ minutes per day 6. During the last 7 days, on how many days did you walk for at least 10 minutes at a time as part of your work? Please do not count any walking you did to travel to or from work. _____ days per week No job-related walking Skip to PART 2: TRANSPORTATION 7. How much time did you usually spend on one of those days walking as part of your work? _____ hours per day _____ minutes per day PART 2: TRANSPORTATION PHYSICAL ACTIVITY These questions are about how you traveled from place to place, including to places like work, stores, movies, and so on. 8. During the last 7 days, on how many days did you travel in a motor vehicle like a train, bus, car, or tram? _____ days per week No traveling in a motor vehicle Skip to question 10 9. How much time did you usually spend on one of those days traveling in a train, bus, car, tram, or other kind of motor vehicle? _____ hours per day _____ minutes per day Now think only about the bicycling and walking you might have done to travel to and from work, to do errands, or to go from place to place. 10. During the last 7 days, on how many days did you bicycle for at least 10 minutes at a time to go from place to place? _____ days per week No bicycling from place to place Skip to question 12 11. How much time did you usually spend on one of those days to bicycle from place to place? _____ hours per day _____ minutes per day 12. During the last 7 days, on how many days did you walk for at least 10 minutes at a time to go from place to place? _____ days per week No walking from place to place Skip to PART 3: HOUSEWORK, HOUSE MAINTENANCE, AND CARING FOR FAMILY 13. How much time did you usually spend on one of those days walking from place to place? _____ hours per day _____ minutes per day PART 3: HOUSEWORK, HOUSE MAINTENANCE, AND CARING FOR FAMILY This section is about some of the physical activities you might have done in the last 7 days in and around your home, like housework, gardening, yard work, general maintenance work, and caring for your family. 14. Think about only those physical activities that you did for at least 10 minutes at a time. During the last 7 days, on how many days did you do vigorous physical activities like heavy lifting, chopping wood, shoveling snow, or digging in the garden or yard? _____ days per week No vigorous activity in garden or yard Skip to question 16 15. How much time did you usually spend on one of those days doing vigorous physical activities in the garden or yard? _____ hours per day _____ minutes per day 16. Again, think about only those physical activities that you did for at least 10 minutes at a time. During the last 7 days, on how many days did you do moderate activities like carrying light loads, sweeping, washing windows, and raking in the garden or yard? _____ days per week No moderate activity in garden or yard Skip to question 18 17. How much time did you usually spend on one of those days doing moderate physical activities in the garden or yard? _____ hours per day _____ minutes per day 18. Once again, think about only those physical activities that you did for at least 10 minutes at a time. During the last 7 days, on how many days did you do moderate activities like carrying light loads, washing windows, scrubbing floors and sweeping inside your home? _____ days per week No moderate activity inside home Skip to PART 4: RECREATION, SPORT AND LEISURE-TIME PHYSICAL ACTIVITY 19. How much time did you usually spend on one of those days doing moderate physical activities inside your home? _____ hours per day _____ minutes per day PART 4: RECREATION, SPORT, AND LEISURE-TIME PHYSICAL ACTIVITY This section is about all the physical activities that you did in the last 7 days solely for recreation, sport, exercise or leisure. Please do not include any activities you have already mentioned. 20. Not counting any walking you have already mentioned, during the last 7 days, on how many days did you walk for at least 10 minutes at a time in your leisure time? _____ days per week No walking in leisure time Skip to question 22 21. How much time did you usually spend on one of those days walking in your leisure time? _____ hours per day _____ minutes per day 22. Think about only those physical activities that you did for at least 10 minutes at a time. During the last 7 days, on how many days did you do vigorous physical activities like aerobics, running, fast bicycling, or fast swimming in your leisure time? _____ days per week No vigorous activity in leisure time Skip to question 24 23. How much time did you usually spend on one of those days doing vigorous physical activities in your leisure time? _____ hours per day _____ minutes per day
- Again, think about only those physical activities that you did for at least 10 minutes at a time. During the last 7 days, on how many days did you do moderate physical activities like bicycling at a regular pace, swimming at a regular pace, and doubles tennis in your leisure time? _____ days per week No moderate activity in leisure time Skip to PART 5: TIME SPENT SITTING
- How much time did you usually spend on one of those days doing moderate physical activities in your leisure time? _____ hours per day _____ minutes per day PART 5: TIME SPENT SITTING The last questions are about the time you spend sitting while at work, at home, while doing course work and during leisure time. This may include time spent sitting at a desk, visiting friends, reading or sitting or lying down to watch television. Do not include any time spent sitting in a motor vehicle that you have already told me about.
- During the last 7 days, how much time did you usually spend sitting on a weekday? _____ hours per day _____ minutes per day
- During the last 7 days, how much time did you usually spend sitting on a weekend day? _____ hours per day _____ minutes per day This is the end of the questionnaire, thank you for participating.