Exploring the relative importance of skill and character choice in Super Smash Bros.
by Michael Kasumovic*Email: m.kasumovic@unsw.edu.au
Received: 17 May 2024 / Published: 14 Sep 2026
Abstract
Player skill plays an important role in contest outcomes. Players could, however, moderate the outcomes of contests through strategic choices prior to entering that contest. In most competitive systems, it is difficult to explicitly model the importance of a player’s strategic choice relative to skill. New Esports tournament data provides an opportunity to address this problem. The role of character choice, representing a clear strategic choice on the part of the player, presents a novel area for model development. Leveraging a Bradley-Terry model, our study analyzed a comprehensive dataset from the Ausmash website which records Super Smash Bros tournament results in Australia and New Zealand. Two models were developed: the first examining the influence of individual character choice, and the second exploring specific character matchups and their outcomes. Results indicated that while player skill remains the predominant factor in determining match outcomes, character choice also significantly influences these outcomes. We found no evidence of intransitivity in the results. Certain characters were found to have a higher correlation with winning, aligning broadly with the perceptions of character strengths within the Esports community. This analysis demonstrates the simultaneous importance of player skill along with player strategic choice. Esports tournament data represents a new opportunity for developing models and theory related to competitive outcomes.
Introduction
The common thread in sport, whether traditional physical sports or Esports, is that they are games of skill. The skill of the competitors is therefore a primary factor in determining the outcome of matches. A substantial body of statistical research has examined player skill in pairwise or head-to-head sports, with one of the key goals being to estimate player skill and then allow for further model development. The first model for player skill was posed by Bradley and Terry (Bradley and Terry, 1952), and it has since been built on by many others such as Elo (Elo, 1978) and Glickman (Glickman, 1999). Each of these models use prior match results to calculate an “ability score” or “skill rating” for a player (these terms are interchangeable) with wins increasing a player’s rating and losses decreasing it. These ratings can then be used to predict future match outcomes in probabilistic terms. This has successfully been done in many physical sports such as tennis (McHale and Morton, 2011), cricket (Dewart and Gillard, 2018), UFC (Dixson et al., 2018), chess (Hankin, 2020), and UFC (Dixson et al. 2018). It is thus no surprise that these models are also useful in Esports. In fact, player-skill models are essential components of the matchmaking and ranking algorithms that have allowed many Esports games to become popular (Portillo, 2019).
While skill is the primary determinant of match outcomes, other factors can affect outcomes. One prominent example in physical sports is handedness. Research has shown that left-handed players are overrepresented at an elite level in a wide variety of sports such as tennis (Hagemann, 2009), cricket (Brooks et al., 2004), and boxing (Gursoy, 2009). The reasons for this advantage remain debated, but regardless of the mechanism, handedness stands out as a clear case of match outcomes being shaped by a factor independent of player skill.
In Esports, a potential analogue to non-skill factors influencing competitive outcomes is character selection. Many Esports titles incorporate a character selection phase, during which players choose from a roster of characters possessing distinct abilities, strengths, and weaknesses. In Super Smash Bros. Melee (hereafter Melee)—the second instalment of the Super Smash Bros. series, released in 2001—character selection may be a particularly salient factor. Anecdotal accounts within the Melee community indicate that certain characters confer a competitive advantage, especially in specific character matchups.
Our goal is to use tournament results in Melee to examine the hypothesis that character choice plays a role in match outcomes. More specifically, our prediction is that some characters have a greater correlation to winning than others. We will explore this question using a modern version of the Bradley-Terry model (Turner and Firth, 2012). One of the primary advantages of using the Bradley-Terry model is that it allows the inclusion of traits associated with the competitors that allow the modelling of their relative importance to contest outcomes. The Bradley-Terry model is thus appropriate to explore the relative importance of player skill and character choice while also providing the opportunity to rank all the characters in a single model to compare to community ’tier lists’.
We thus have two goals in this study. Our first goal is to analyse the effect of character choice on match outcomes (Model 1). In this model, we use all the available data on match outcomes where we predict that character choice will have a significant impact on match outcomes. Additionally, we predict that the ordering of strong and weak characters in the data analysis will broadly agree with community perception (i.e. current tier lists). Our second goal is to explore whether there is any intransitivity in match outcomes between particular characters (Model 2). This question is of interest as there are discussions within the player community that suggest specific characters are more appropriate to compete against certain opposing characters. To explore this question, we select a subset of the most popular characters and analyse individual pairwise matchups.
Methodology
Dataset
We analysed data available at https://ausmash.com.au. This website stores tournament results for the Super Smash Bros video game series from Australia and New Zealand. The site was created in 2014 and almost all tournaments held since then have been uploaded to the site. A few of the larger tournaments that occurred before that date have also been added. The Ausmash website records individual match results for each tournament, alongside character data. Most of these tournaments have entry fees and prizes, so it is assumed that players are trying their best to win these matches, as opposed to practice games which are not included in this dataset. The data for the statistical models was downloaded in June 2021. At this time, the Ausmash website had 49,141 matches for Melee between two players with profiles on the website. However, not all matches have character data recorded. This is because only the data on player names and match results are recorded at the tournament, then players are able to subsequently upload their character data by logging on to the website. We focused on Melee because it has the highest sample size per character matchup of all the games on the website.
The number of matches per player is very strongly right-skewed (see Figure 1a). This is because most tournaments use a double elimination format and the large number of players with 2 matches represent players who attended a single tournament and lost both their matches. There is also a correlation between players and character choice, and the number of matches per character. As such, the per-character matchup is strongly right-skewed (see Figure 1b, 1c).
Figure 1: Ausmash dataset statistics. (a) Number of matches per player. (b) Number of matches per character. (c) Number of matches per pairwise character matchup. (Note: (c) excludes matches where both players chose the same character.)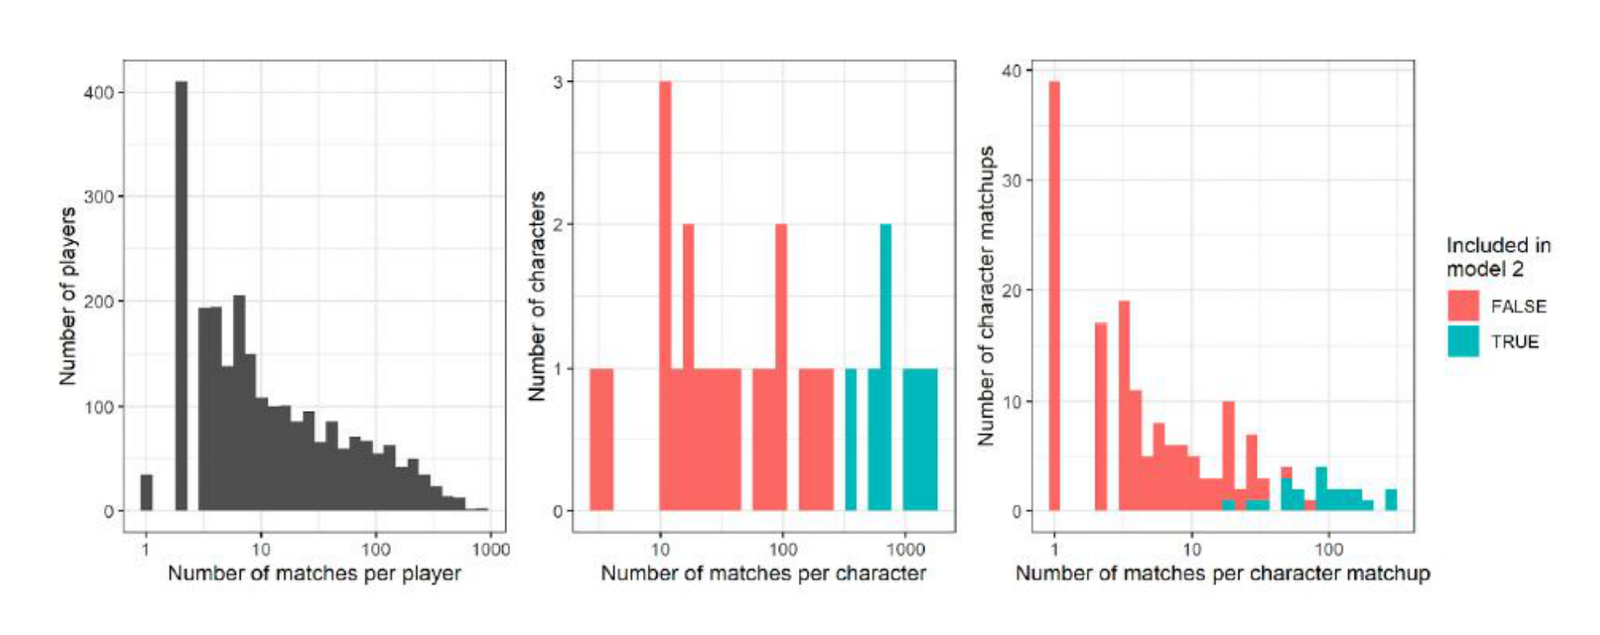
Statistical Analyses
We used a Bradley-Terry statistical model in R using the BradleyTerry2 package (Turner and Firth, 2012) to analyse the dataset. Bradley-Terry is designed to examine repeated pairwise contests between individuals of varying skill (Turner and Firth, 2012). The model uses match outcome data to estimate an ability score for each player which is similar in functionality to ELO and other competitive ranking systems. The advantage of the Bradley-Terry model is that it can also estimate the effect of predictive “traits” on match outcomes. These competitive “traits” can be permanent for each competitor (e.g. a player’s age or size), or they can vary from match to match, like a player’s choice of character in the Super Smash Bros Melee dataset. This approach is similar to previous studies which have used a Bradley-Terry model to examine predictive traits such as the size of a chameleon (Stuart-Fox et al., 2006) or beardedness in UFC fighters (Dixson et al., 2018).
The Bradley-terry Model
The Bradley-Terry model is a generalised linear mixed model using both fixed and random effects. Like many other statistical models of player skill in sports, the Bradley-Terry model uses a numerical parameter for the ability score λi of player i. This parameter can be used to calculate the probability of a given match outcome as
logit(P (i, j)) = λi − λj
where P (i, j) is the probability that player i wins against player j.
The BradleyTerry2 R package estimates these ability scores by modelling them as
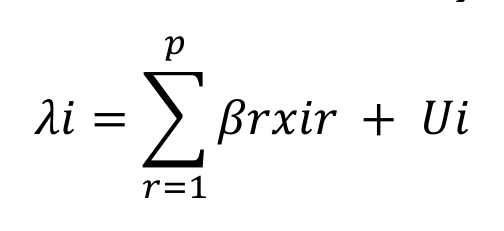
In this model, the ability of each player i is related to a set of explanatory variables xi1, ..., xip, which relate to characters in model 1 and matchup in model 2. β1, ..., βp are the coefficients which determine the relative strength of each character/matchup. Finally, Ui ~ N (0, σ2) is a random variable which in this study relates to the impact of player skill following the same approach as more general mixed models such as in Bates et al. (2015). Because these ability scores can only be used to determine match outcome probability in pairs, they cannot be calculated in isolation. Therefore, the model must have a reference to compare to when making calculations. It does this by setting the ability score of the first node in the dataset to zero, and calculating the ability score of all other nodes relative to this reference.
In Model 1, we examined the relative effect of different characters on match outcomes and allowed the creation of an ability score for each individual character. In this model, the {xir} and {βr} values relate to each of the characters included in the model. We only included characters that had at least one win, leaving 24 characters used in 3,673 matches. There were a further 45,468 matches included in the dataset that had only player information (i.e. no character choice information was present) which contributed to calculating the effect of player skill only. We chose to use Fox as the reference character as he is the most popular character in the dataset so this choice minimises the error terms observed.
In Model 2, we examined the effect of character matchups where each pair of characters was given a separate term in the model. That is, the {xir} and {βr} values correspond to matchups of the form A vs B where A and B are characters. It was necessary to restrict the characters examined in model 2 due to the large number of pairwise matchups in the dataset with negligible sample size (see Figure 1c). We included only the 7 most popular characters in model 2 as the matchups between these 7 characters made up 61% of all matches with character data and maximised our ability to explore the effects of particular matchups. There were a total of 2,254 matches of the 21 pairwise matchups between these 7 characters. We once again used each player as a random effect to remove the effect of player ability on match outcomes which was calculated using the full dataset. There were a total of 46,887 matches that had only player information (i.e. no matchup data was present) which contributed to calculating the effect of player skill only. The reference node chosen for model 2 was Sheik vs Sheik, as using a reference node of the form A vs A makes the output symmetric (i.e. βAvsB = −βBvsA). All relevant files used in the modelling can be found on GitHub at https://github.com/InvisiAU/masters-thesis-2022.
Study Context
We used the output of model 1—an ability score for each character—to create an ordered ranking of the characters in Melee. Such ordered rankings of the characters in an esport are often referred to as a ‘tier list’ or ‘matchup chart’. The output of model 2 (an ability score for each pairwise matchup) can be plotted in a matrix which can be used to look up which character is favoured in each pairwise matchup. Creating tier lists or matchup charts is common in Esports communities but is generally done based on subjective opinion. By using the Bradley-Terry model, we can test whether community created tier lists are supported by data.
At the time of writing, the most well-known and respected source of wisdom on the strength of different characters in Melee is the Official Melee Tier List (henceforth: Melee tier list) (Netisco, 2021). This tier list is a ranking of the characters based on the opinions of highly ranked players in the community. This tier list has several important differences in methodology with our study. First, the tier list is based on subjective opinions rather than data. Second, the tier list is weighted towards top level play compared to data used in this study which are from all levels of play. Third, the tier list takes opinions from around the globe (mostly from the USA and Japan where Melee is most popular), while this study examined a dataset of results from Australia and New Zealand only.
Results
Character Choice
We used a chi-squared test to examine the correlation between player and character choice in the dataset. We found a strong association between player and character choice (χ2 = 135638, df = 17675, p < 2.2 × 10⁻¹⁶), meaning that players tend to repeatedly choose the same character(s). Using Kendall’s rank correlation test, we found that players’ character choices were strongly correlated with the Melee tier list (τ = −0.737, z = −5.04, p = 4.73 × 10⁻⁷), meaning that characters rated highly by the Melee tier list are chosen more often by players
Figure 2: Character sample size vs Melee tier list rank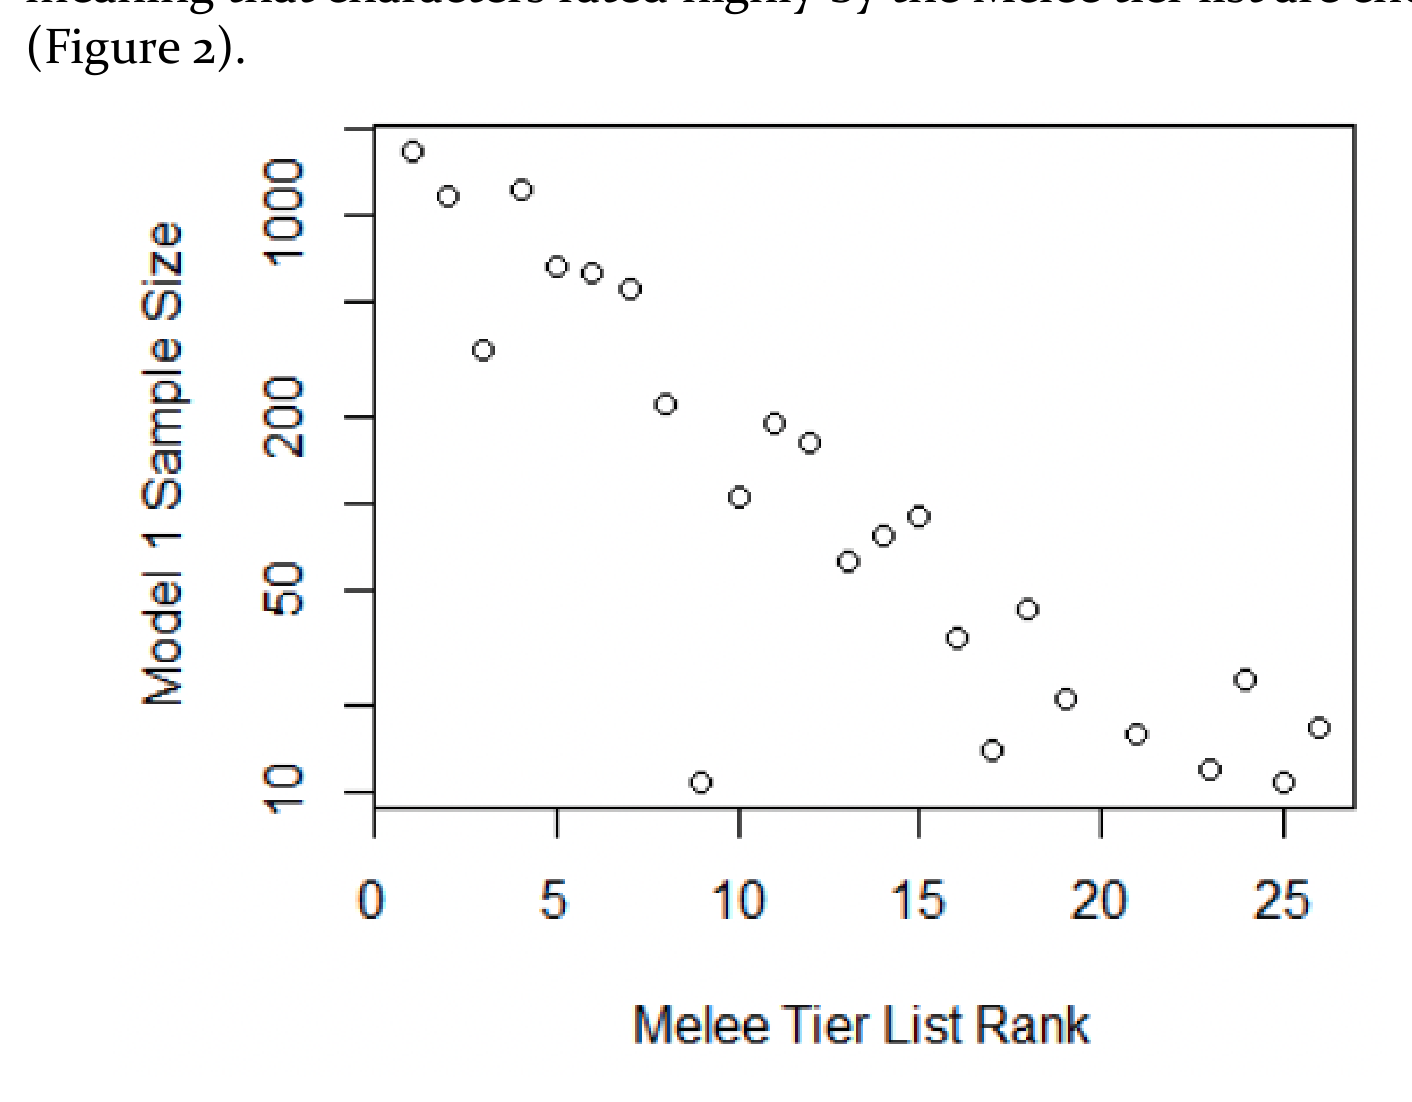
Model 1
As an initial check, we plotted the deviance residuals for each of the matches in the model. As expected, the model accurately predicts match outcomes with a reasonable degree of certainty, as shown by the right-skew in Figure 3.
Figure 3: The deviance residuals for Model 1.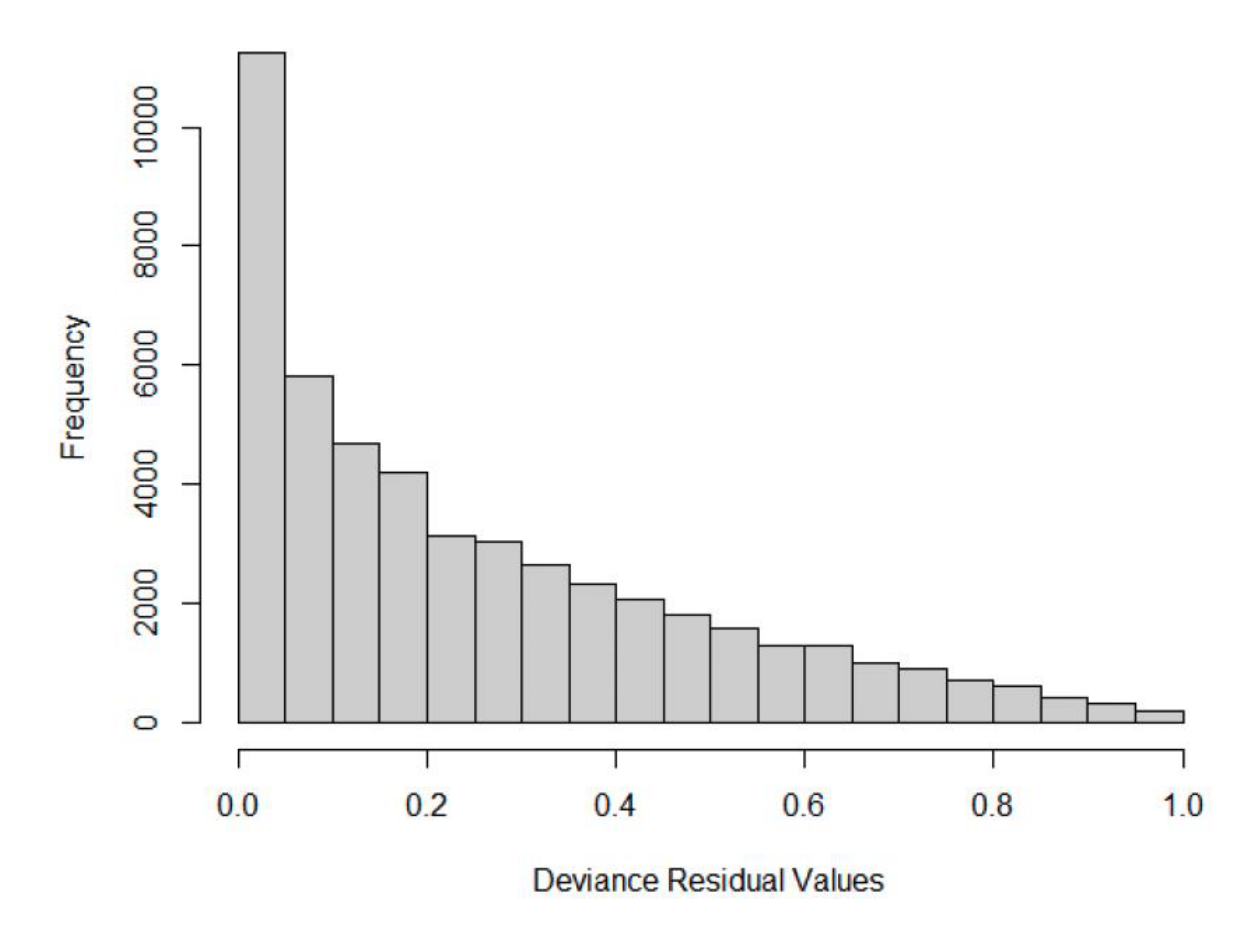
The largest effect size within the results of model 1 is the effect of player (σ = 2.333 ± 0.042, z = 55.9, p < 2.2 × 10⁻¹⁶), which indicates a strong effect of player skill on match outcomes. Two characters - Sheik (0.361 ± 0.134, z = 2.69, p = 0.0071) and Kirby (−2.646 ± 0.994, z = −2.66, p = 0.0078) – met the threshold for statistical significance relative to Fox. The results for each character can be found in Table 1 and Figure 4.
We ran a Pearson product-moment correlation test between the base 10 logarithm of character sample size and the model results. This showed a significant correlation to both the ability score estimates (cor = 0.766, t = 5.59, df = 22, p = 1.29 × 10⁻⁵) and the standard errors (cor = −0.921, t = −10.8, df = 21, p = 4.92 × 10⁻¹⁰). This means that characters with larger sample sizes generally had greater ability score estimates with smaller error terms (Figure 5). We also used Kendall’s rank correlation test to compare the results of model 1 with the Melee tier list, showing a significant correlation (τ = 0.604, z = 4.32, p = 1.55 × 10⁻⁵). This means that the results of Model 1 generally agree with the Melee tier list
Table 1: Tabulated results of Model 1 showing the sample size for each character (N) and the results from Model 1.| Rank | Character | N | Score | Error | p |
|---|---|---|---|---|---|
| 1 | Sheik | 665 | 0.361 | 0.134 | 0.007 |
| 2 | Link | 43 | 0.350 | 0.457 | 0.444 |
| 3 | Jigglypuff | 343 | 0.230 | 0.172 | 0.180 |
| 4 | Marth | 1150 | 0.210 | 0.108 | 0.052 |
| 5 | Falco | 1229 | 0.124 | 0.106 | 0.240 |
| 6 | Captain Falcon | 634 | 0.074 | 0.132 | 0.576 |
| 7 | Ice Climbers | 220 | 0.036 | 0.222 | 0.871 |
| 8 | Samus | 189 | 0.015 | 0.221 | 0.945 |
| 9 | Fox | 1654 | 0 | NA | NA |
| 10 | Peach | 558 | -0.024 | 0.139 | 0.861 |
| 11 | Luigi | 163 | -0.102 | 0.251 | 0.685 |
| 12 | Ganondorf | 78 | -0.140 | 0.359 | 0.696 |
| 13 | Yoshi | 105 | -0.425 | 0.287 | 0.138 |
| 14 | Donkey Kong | 34 | -0.452 | 0.531 | 0.394 |
| 15 | Dr. Mario | 63 | -0.591 | 0.460 | 0.198 |
| 16 | Mr. Game and Watch | 21 | -0.600 | 0.631 | 0.342 |
| 17 | Mario | 91 | -0.638 | 0.388 | 0.100 |
| 18 | Zelda | 25 | -0.849 | 0.611 | 0.165 |
| 19 | Young Link | 14 | -0.851 | 0.900 | 0.345 |
| 20 | Ness | 12 | -0.877 | 1.104 | 0.427 |
| 21 | Roy | 16 | -0.983 | 1.072 | 0.359 |
| 22 | Bowser | 17 | -1.079 | 0.832 | 0.195 |
| 23 | Pikachu | 11 | -1.519 | 1.193 | 0.203 |
| 24 | Kirby | 11 | -2.646 | 0.994 | 0.008 |
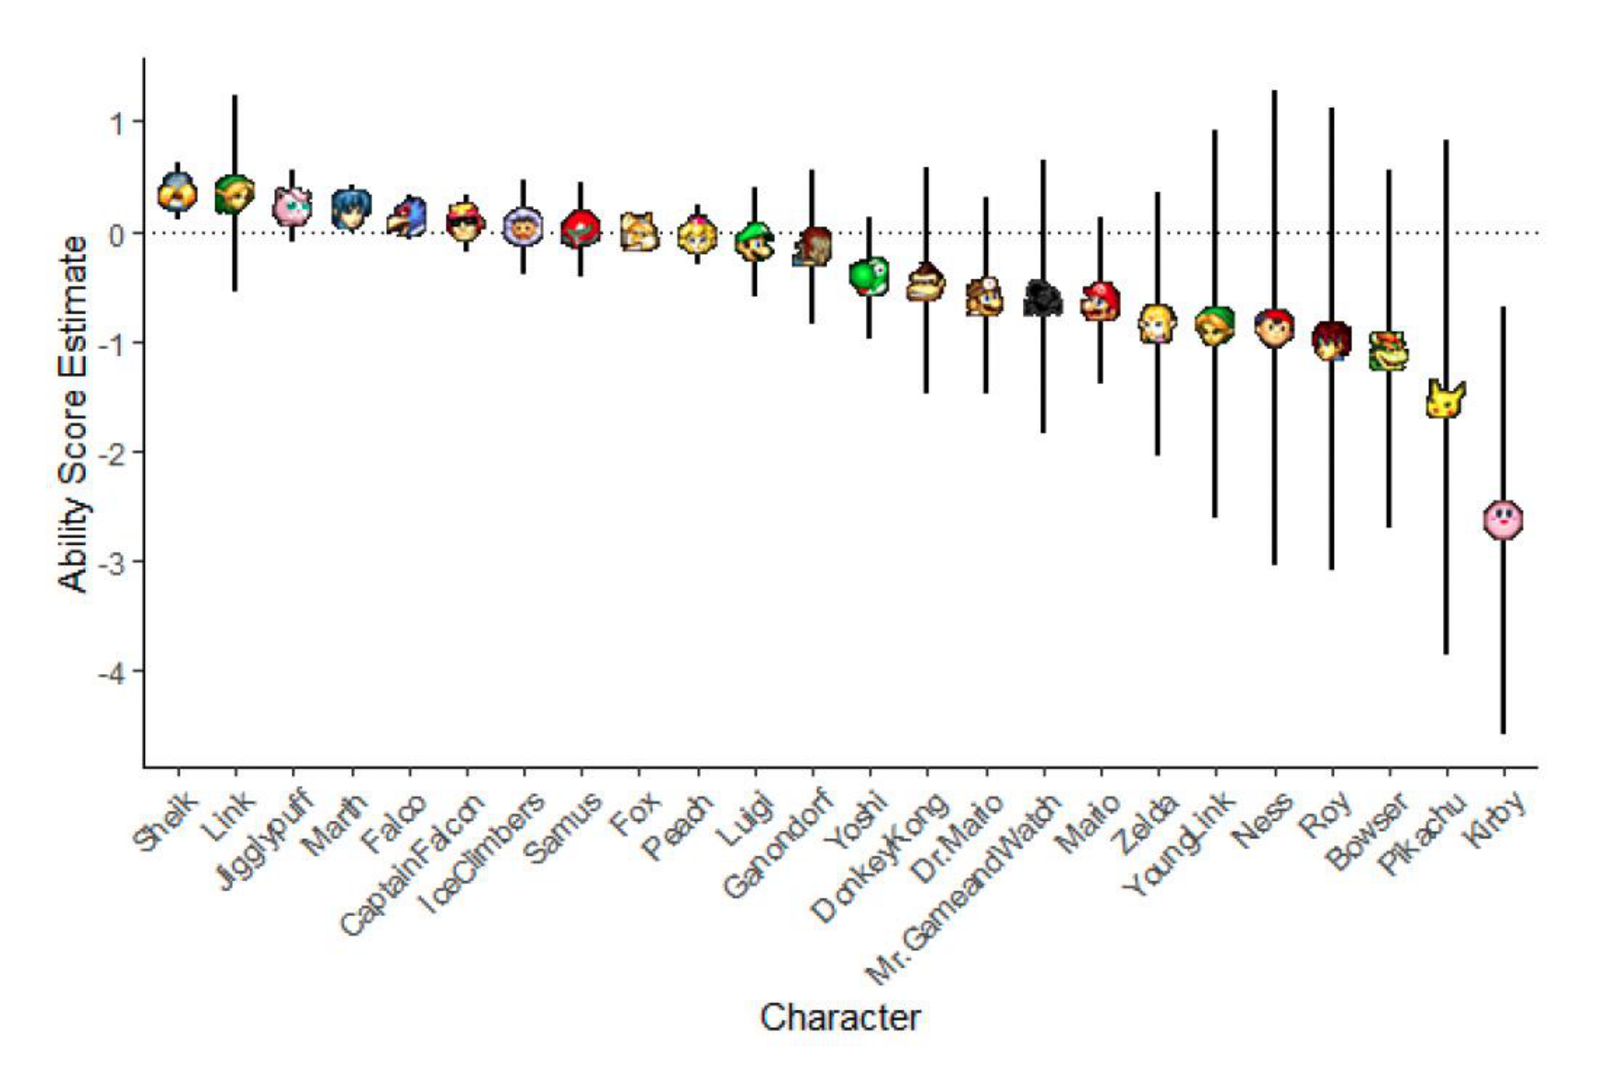 Figure 4: Results of Model 1 - ability score estimate and 95% confidence interval for each character.
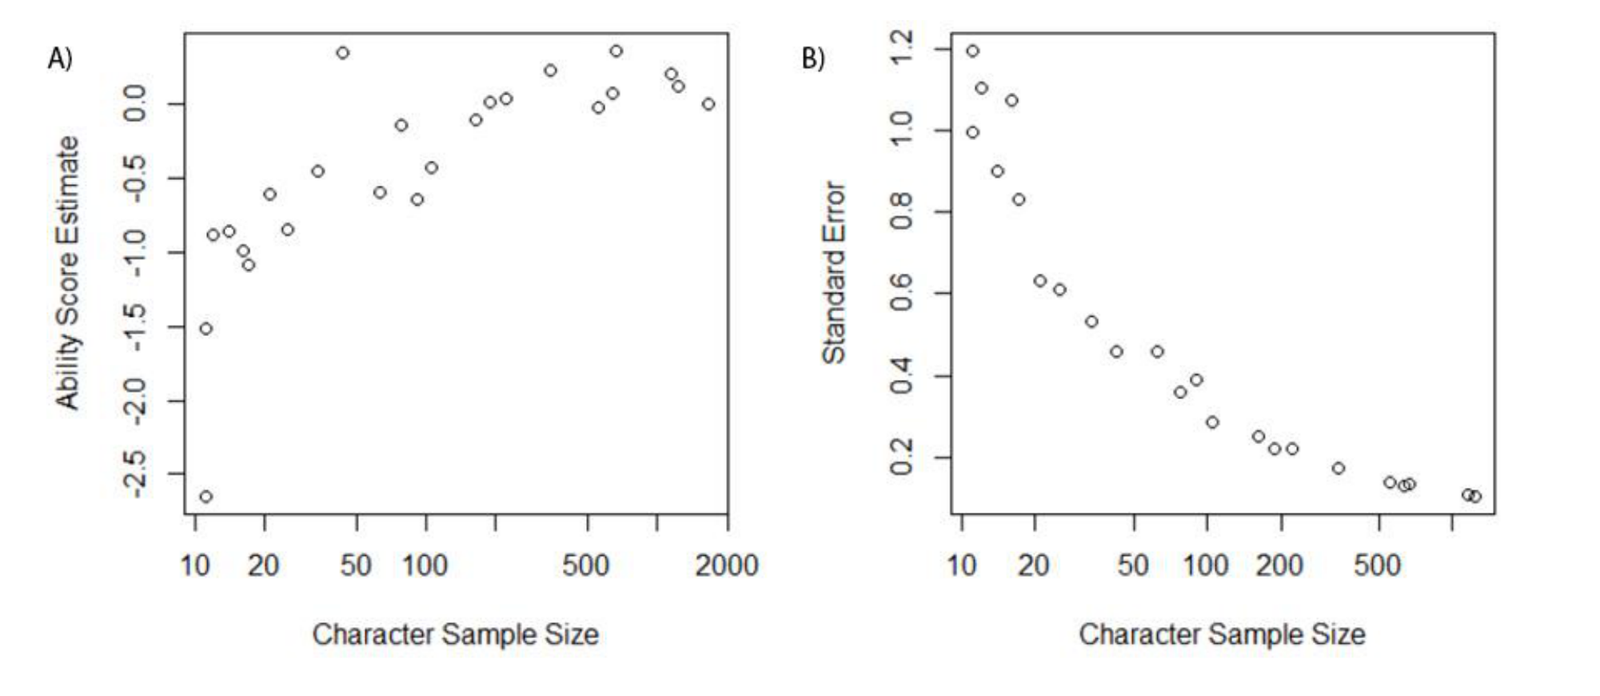
Figure 5: (A) Ability score estimate and (B) standard error results of model 1 relative to character sample size.
Model 2
We plotted the deviance residuals for each of the matches in the model. The Results in
Figure 6 are similar to those for Model 1.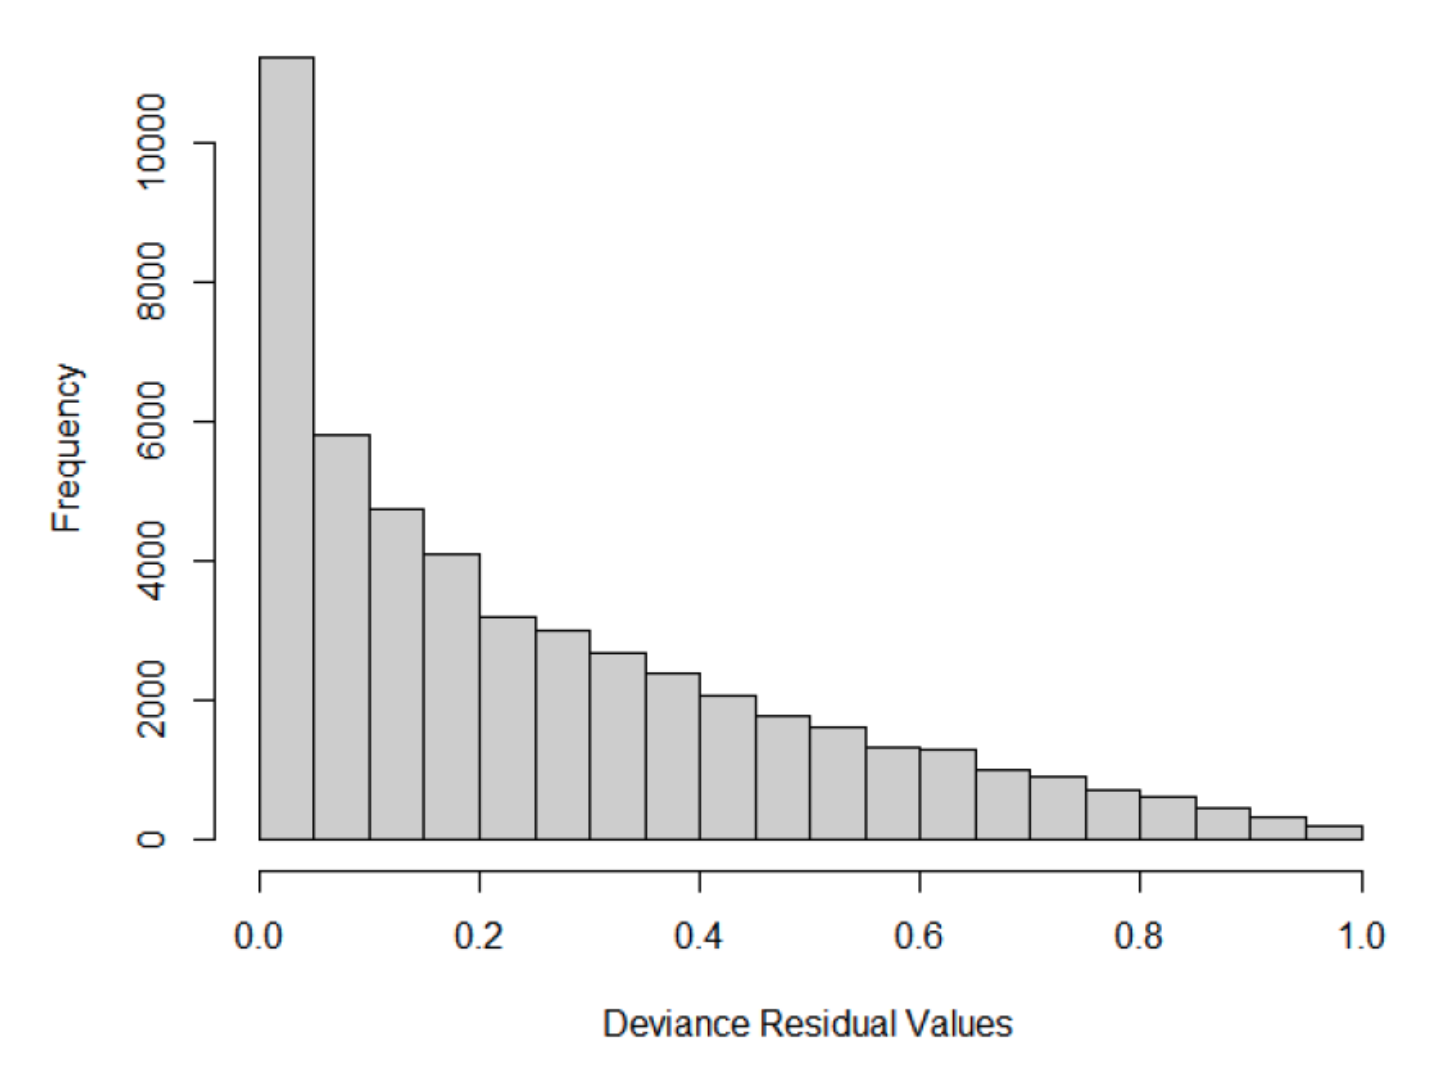
Figure 6: The deviance residuals for Model 2.
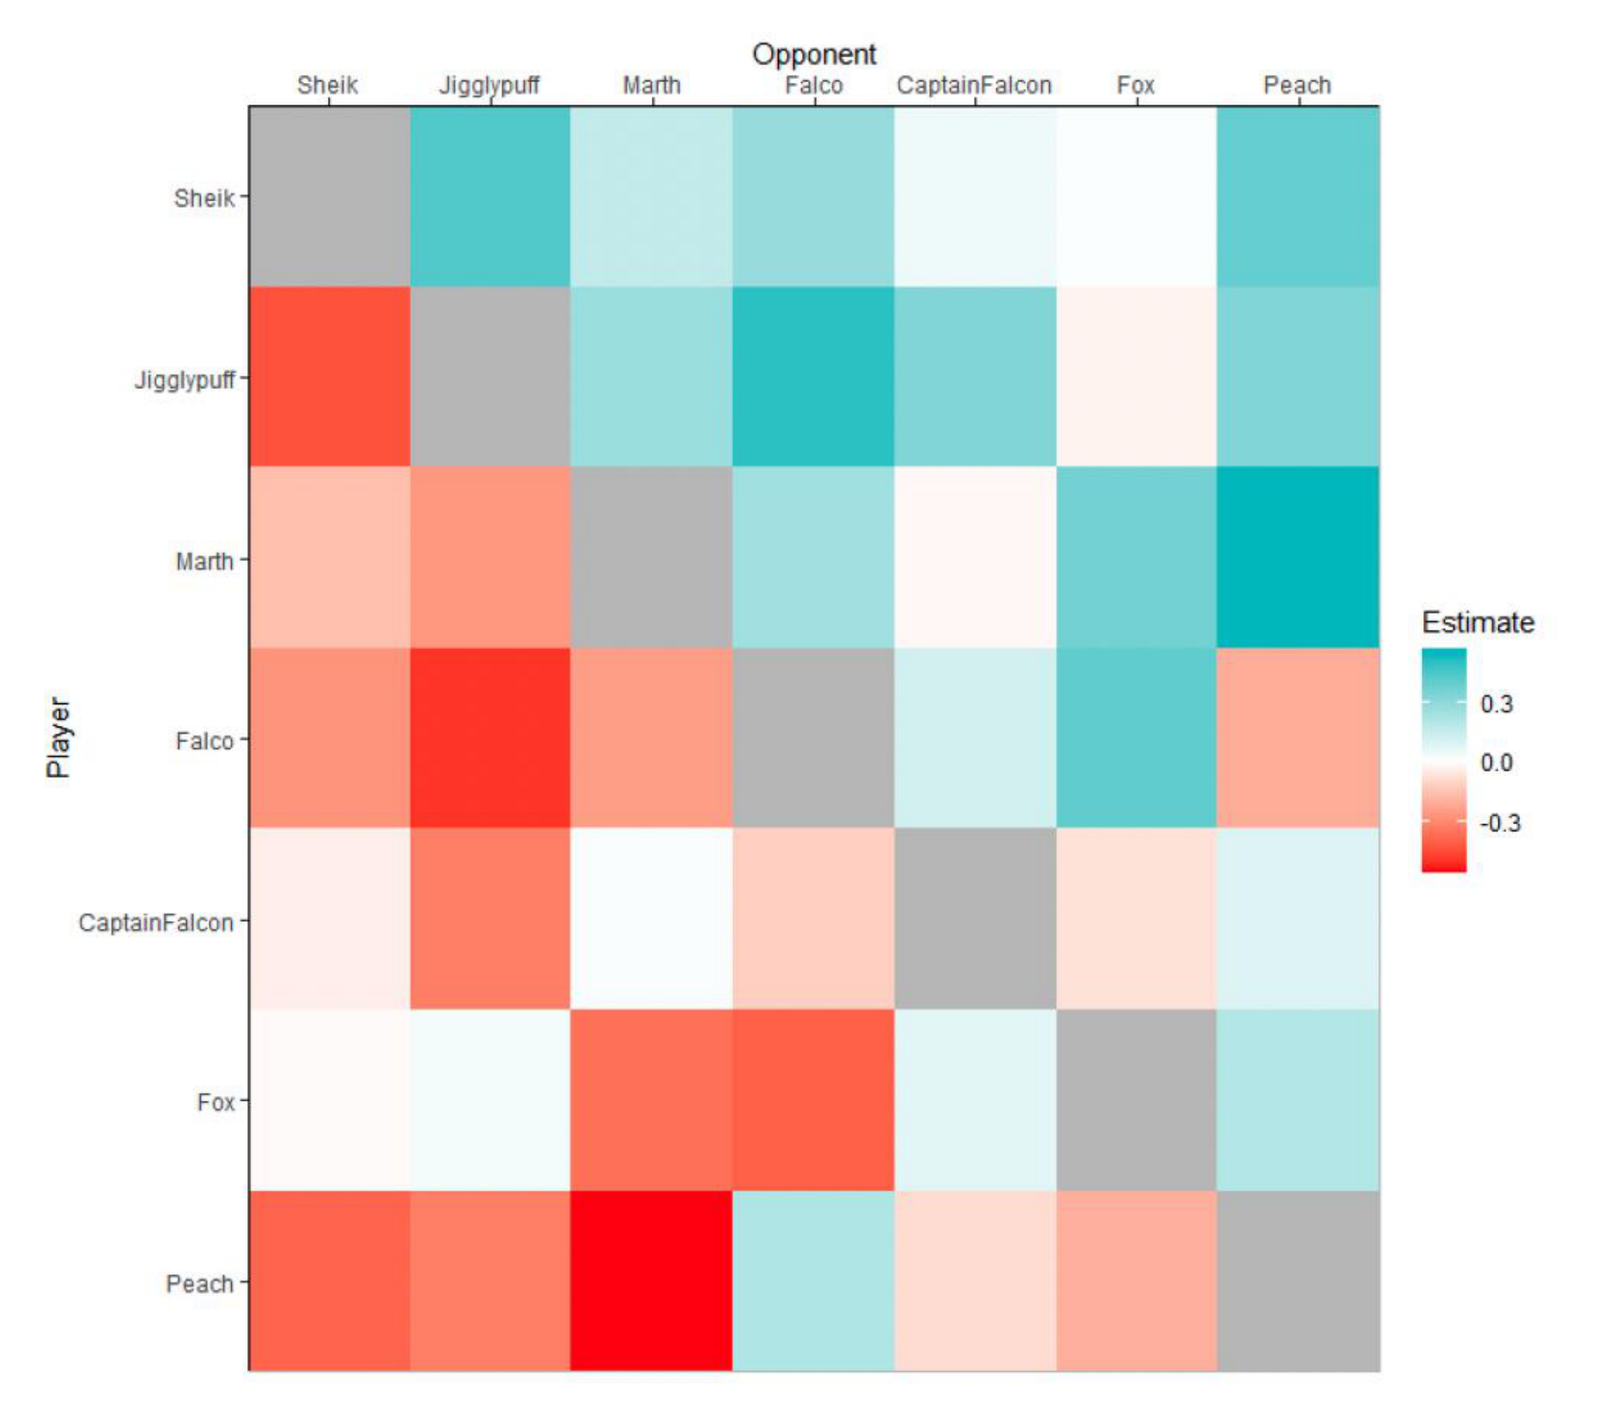
Like in Model 1, a very significant random effect was observed in Model 2 (σ = 2.330 ± 0.042, z = 55.9, p < 2.2 × 10⁻¹⁶) indicating a significant effect of the player on match outcomes. Two matchups met the threshold for statistical significance, Falco vs Fox (0.406 ± 0.159, z = 2.55, p = 0.01) and Fox vs Marth (−0.364 ± 0.157, z = −2.32, p = 0.02). For both of these matchups, the results favour Fox’s opponent; 17 of the 21 matchups agree with the ordering of characters given by the results of Model 1. The results for each matchup can be found in
Table 2 and Figure 7.
Table 2: Tabulated results of Model 2 showing the sample size for each character (N) and the results from Model 1.| Player | Opponent | N | Score | Error | p |
|---|---|---|---|---|---|
| Captain Falcon | Falco | 103 | -0.120 | 0.262 | 0.647 |
| Captain Falcon | Fox | 151 | -0.075 | 0.218 | 0.729 |
| Captain Falcon | Jigglypuff | 28 | -0.328 | 0.498 | 0.510 |
| Captain Falcon | Marth | 113 | 0.016 | 0.260 | 0.948 |
| Captain Falcon | Peach | 66 | 0.089 | 0.321 | 0.781 |
| Captain Falcon | Sheik | 53 | -0.041 | 0.376 | 0.913 |
| Falco | Fox | 287 | 0.406 | 0.159 | 0.010 |
| Falco | Jigglypuff | 65 | -0.499 | 0.336 | 0.137 |
| Falco | Marth | 204 | -0.249 | 0.187 | 0.182 |
| Falco | Peach | 98 | -0.209 | 0.269 | 0.437 |
| Falco | Sheik | 141 | -0.276 | 0.224 | 0.219 |
| Fox | Jigglypuff | 86 | 0.029 | 0.287 | 0.917 |
| Fox | Marth | 300 | -0.364 | 0.157 | 0.020 |
| Fox | Peach | 132 | 0.202 | 0.233 | 0.386 |
| Fox | Sheik | 154 | -0.010 | 0.231 | 0.963 |
| Jigglypuff | Marth | 50 | 0.266 | 0.409 | 0.515 |
| Jigglypuff | Peach | 20 | 0.328 | 0.600 | 0.584 |
| Jigglypuff | Sheik | 37 | -0.438 | 0.447 | 0.327 |
| Marth | Peach | 85 | 0.564 | 0.313 | 0.071 |
| Marth | Sheik | 88 | -0.162 | 0.275 | 0.554 |
| Peach | Sheik | 56 | -0.393 | 0.335 | 0.240 |
We ran a Pearson product-moment correlation test between the base 10 logarithm of matchup sample size and the absolute values of the model results. This showed a significant correlation to the standard errors (cor = −0.973, t = −18.4, df = 19, p = 1.45 × 10⁻¹³), but no correlation to the size of the ability score estimates (cor = −0.156, t = −0.688, df = 19, p = 0.500). This means that matchups with larger sample sizes generally had smaller error terms, but with no correlation to the size of the ability score. These correlations can be observed in Figure 8.
Figure 8: (A) Ability score estimate and (B) standard error results of Model 2 relative to matchup sample size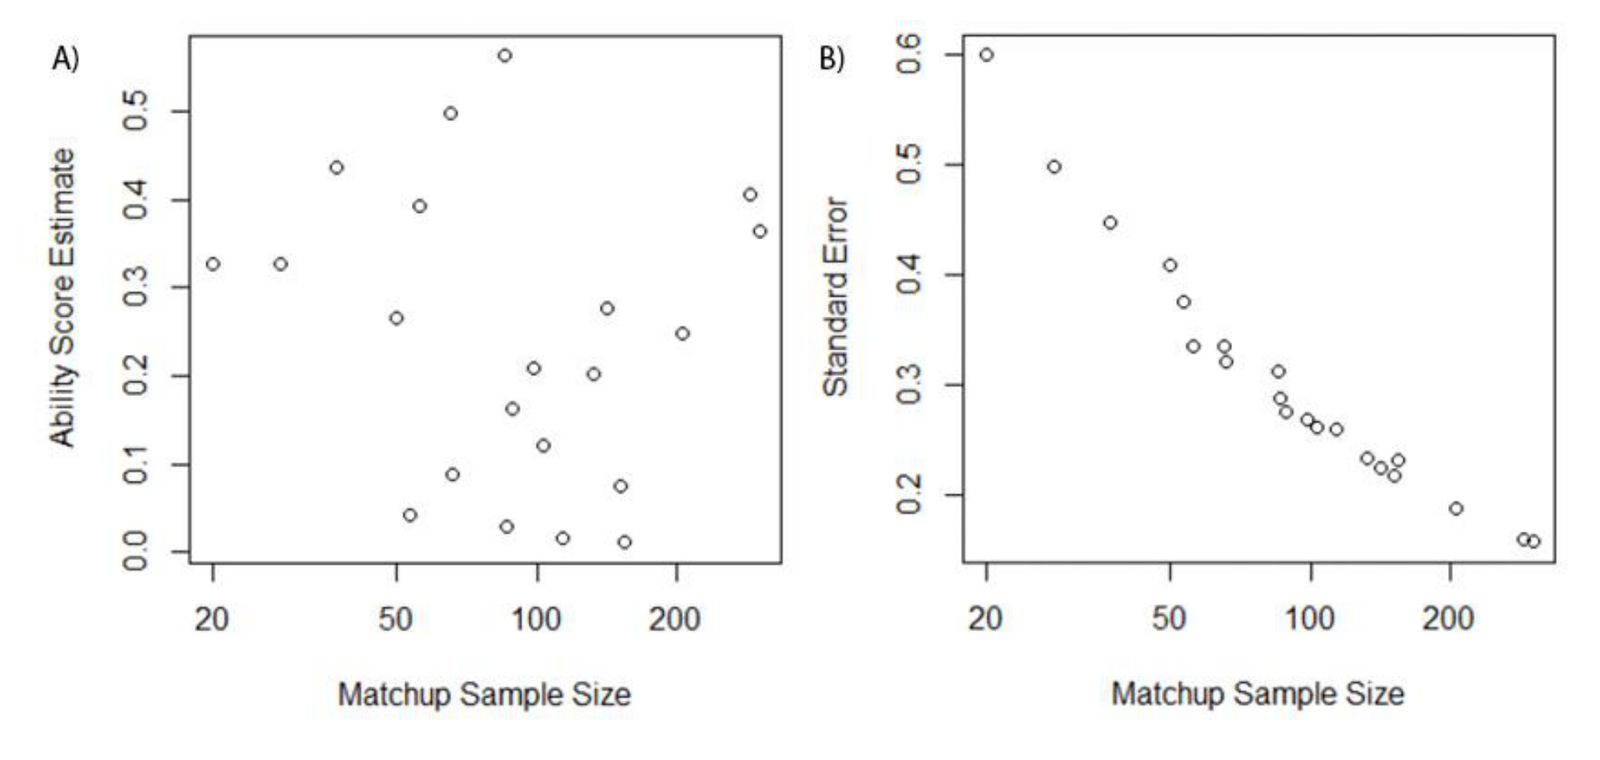
Discussion
The goal of this study was to explore the hypothesis that the asymmetric nature of character choice in Esports will have a significant effect on match outcomes. To test this hypothesis, we collected Super Smash Bros Melee data to explore (1) the role that individual characters have on match outcomes, and (2) whether intransitivity arises between specific characters. The strongest result in both Bradley-Terry models is the effect of player skill. Both models estimated the effect of player skill to be significantly greater than that of any of either character or matchup. This means that variability in player skill levels has a larger effect on match outcomes than character choice. This result is unsurprising since Esports, like physical sports, are primarily tests of skill. Nonetheless, there was a clear effect of character skill in the results of the contests. The evidence for intransitivity was equivocal, suggesting that its effect, if it exists, is likely small.
Our results also suggest that a player’s choice of character is significantly affected by the Melee tier list (Figure 2). The phenomenon of character popularity correlating to perceived strength is common in many Esports (Kokkinakis et al., 2021) and makes it difficult to gather data on characters who are perceived to be weaker. Therefore, it is unsurprising that the results of the less popular characters had much larger error terms (Figure 4) and that many of them needed to be excluded from Model 2. Future studies that randomly assign characters to players of varying skills level would help to disentangle the relative importance of player skill and character choice.
Another important feature of the data is that players tend to repeatedly choose the same character(s). A player’s skill level is inherently tied to the hours of practice (sometimes in the thousands) that a player has spent with their chosen character. Whether a particular player would be more or less skilled if they had invested that same time into a different character is an entirely hypothetical question that cannot be answered by these data. It is also possible that player-character fit may be a more important factor than the strength of characters in isolation. This phenomenon, where individual players have a different optimal choice of a tool, has been observed in physical sports. Some examples include swimming, where a well-fitted suit tailored to the swimmer has been shown to improve performance (Montagna et al., 2009), and baseball where optimal bat weight has been shown to depend on the physiology of the player (Bahill and Karnavas, 1989). It is possible that this is equally applicable to character choice in Esports; individual players may perform best with different characters because of their playing style or skill level.
Despite the model outputs having little statistical confidence about the results of individual characters or matchups, the correlation test statistics allows us to make inferences about the results. As expected, the two models produced results that broadly agree with each other and with the Melee tier list. Only four of the 21 matchups which were examined in Model 2 favoured the character which was ranked lower by Model 1. Of these, all were less than one standard error from zero with two of them within 0.1 standard error, suggesting there is very little intransitivity in the results. The agreement with the Melee tier list is shown by the high degree of confidence in the correlation test statistic. Although there is a large degree of agreement, we discuss some of the notable differences between the tier list and our results.
First, it is quite notable that Fox, who has been consistently rated as the #1 character in every version of the Melee tier list since 2006, was placed below one third of characters in the study results. This placement is likely due to how technical Fox is to play and how many hours players must practice. As such, only top-level players are successful in using Fox; an explanation which is consistent with a previous study that examined the optimal character choice in Melee (Codsi and Vetta, 2021). In contrast, Sheik, who ranked first in the results of model 1, is often considered to be a simpler character to learn. Indeed, Sheik was rated #1 on the first few iterations of the Melee tier list from 2002 to 2005. This suggests that being simple to learn is an important factor for a character to rank highly in a study (such as this one) with a wide-ranging level of player ability.
The second major difference between the Melee tier list and the results of this study may have more to do with dataset anomalies than with methodological choices. The two most noticeable differences in placements are Pikachu and Link. Pikachu had 11 matches in the dataset and was tied for the lowest sample size of any character. This is surprising for a character who is perceived to be moderately strong. The win ratio of 9% (1 win to 10 losses) likely contributed to Pikachu’s low ability score estimate in this study. Link’s placement is more surprising, achieving the second highest ability score despite a win ratio of 37% (16 wins to 27 losses). However, this may be explained by the distribution of wins and losses; 12 wins came from a single player in New Zealand who has not played any opponents outside their region, while the losses were split more evenly among various players. The difficulty of gathering data on less popular characters means it is unsurprising to see a small number of outliers.
Finally, it is important to recognise that this study was performed on players in Australia and New Zealand only and may not be representative of all Super Smash Bros. players globally. Furthermore, although it is a large data set, it is important to note that despite there being a strong community that still plays the game, Super Smash Bros is not as popular a game as it was during its first release. Future research should thus explore this question in a larger sample size across countries and should be replicated in other games to understand whether the role of character choice varies depending on the game played, character abilities, and the relative importance of how well players and characters are matched to their play style
Conclusion
We explored the relative importance of player skill in character choice in contest outcomes in a popular competitive platformer, Super Smash Bros. Our results demonstrate that character choice is important and that a player’s choice of character is strongly correlated to the Melee tier list and likely determined by other factors such as the ease of learning a character and a player’s individual affinity for a character. Regardless, player skill is a relatively stronger predictor of contest outcomes. However, player skill is the primary determining factor in match outcomes, far more so than character choice. As the saying goes within the Melee community: “A skilled Roy can beat any Fox”. Further studies assigning random characters to players of various skill level would help clarify the relative importance of both skill and character choice.
Acknowledgements
We would like to thank Pavel Krivistsky for coding insight, Heather Turner for all the incredible help with the Bradley-Terry model, and Scott Sisson for help with statistical interpretation.
Ethical Statement
*need to state if any*
Conflict of Interest
*need to state if any*
Funding Statement
This work was not supported by any grants or funding.
References
- Bahill, AT and Karnavas WJ. Determining ideal baseball bat weights using muscle force-velocity relationships. Biological Cybernetics. 1989; 62: 89-97.
- Bates, D, Mächler, M, Bolker, B, & Walker, S. Fitting linear mixed-effects models using lme4. Journal of Statistical Software. 2015; 67: 1–48.
- Block, S and Haack, F.. eSports: a new industry. SHS Web of Conferences. 2021; 92. https://doi.org/10.1051/shsconf/20219204002.
- Bradley, RA and Terry, ME. Rank analysis of incomplete block designs: I. The method of paired comparisons. Biometrika. 1952; 39: 324–345.
- Brooks, R, Bussiére, LF, Jennions, MD, Hunt, J. Sinister strategies succeed at the cricket World Cup. Proceedings of the Royal Society of London. Series B: Biological Sciences. 2004; 271.suppl 3, S64–S66.
- Codsi, J and Vetta, A.. A case study in learning in metagames: Super Smash Bros. Melee. Proceedings of the AAAI Conference on Artificial Intelligence and Interactive Digital Entertainment. 2021; 17: 2– 9.
- Dewart, N and Gillard, J. Using Bradley–Terry models to analyse test match cricket. IMA Journal of Management Mathematics. 2018; 30: 187–207.
- Dixson, BJW, Sherlock, JM, Cornwell, WK, Kasumovic, MK. Contest competition and men’s facial hair: beards may not provide advantages in combat. Evolution and Human Behavior 2018; 39: 147–153.
- Elo, AE. The rating of chessplayers, past and present. 2nd ed. Arco Publishing, New York. 1978.
- Glickman, ME. Parameter estimation in large dynamic paired comparison experiments. Applied Statistics. 1999; 48: 377-394.
- Gursoy, R. Effects of left-or right-hand preference on the success of boxers in Turkey. British Journal of Sports Medicine. 2009; 43: 142– 144.
- Hagemann, N. The advantage of being left-handed in interactive sports. Attention, Perception, & Psychophysics. 2009; 71: 1641–1648.
- Hankin, RKS. A generalization of the Bradley–Terry model for draws in chess with an application to collusion. Journal of Eco nomic Behavior & Organization. 2020; 180: 325–333.
- Kokkinakis, A, York, P, Patra, MS, Robertson, J, Kirman, B, Coates, A, Chitayat, AP, Demediuk, S, Drachen, A, Hook, J, Nolle, I, Olarewaju, O, Slawson, D, Ursu, M. Block, FO. Metagaming and metagames in Esports. International Journal of Esports. 2021; 1: 1-24.
- McHale, I and Morton, A. A Bradley-Terry type model for fore- casting tennis match results. International Journal of Forecasting. 2011; 27: 619–630.
- Montagna, G, Catarino, A, Carvalho, H, Rocha, A.. Study and optimization of swimming performance in swimsuit designed with seamless technology. AUTEX, World Textile Conference. 2009; 26-28.
- Netisco, AP. PGstats presents the first Melee tier list since 2015. 2021 [08/05/2024] Available from: https://www.pgstats.com/articles/super-smash- bros-melee-13th-official-tier-list-character-rankings.
- Portillo, E. ESports Matchmaking, Continuous Integration and Continuous Delivery, Microservices and Full Stack Web Applications. 2019. PhD thesis. California State University, Northridge.
- Stuart-Fox, DM, Firth, D, Moussalli, A, Whiting, MJ. Multiple signals in chameleon contests: designing and analysing animal contests as a tournament. Animal Behaviour. 2006; 71: 1263–1271.
- Turner, H and Firth, D. Bradley-Terry models in R: The BradleyTerry2 package. Journal of Statistical Software. 2012; 48: 1–21.